
Y-Cruncher is a multi-threaded Pi benchmark.
This benchmark is also described here. It claims are record for computing the most digits of pi.
Metrics (Intel) - phoronix/y-crunchersh - pid 18152 On_CPU 0.897 On_Core 7.173 IPC 1.178 Retire 0.480 (48.0%) FrontEnd 0.138 (13.8%) Spec 0.122 (12.2%) Backend 0.260 (26.0%) Elapsed 65.10 Procs 21 Maxrss 2565K Minflt 661484 Majflt 0 Inblock 0 Oublock 976608 Msgsnd 0 Msgrcv 0 Nsignals 0 Nvcsw 31375 (94.5%) Nivcsw 1820 Utime 465.602228 Stime 1.364009 Start 90263.07 Finish 90328.17
The program has ~94.5% voluntary context switches and blocks written out, so there is some I/O. Otherwise a limiter are backend stalls, resulting in an IPC slightly over 1 and a low retirement rate.
Metrics (AMD) - phoronix/y-crunchersh - pid 6382 On_CPU 0.761 On_Core 12.168 IPC 0.842 FrontCyc 0.008 (0.8%) BackCyc 0.014 (1.4%) Elapsed 64.46 Procs 37 Maxrss 2563K Minflt 661224 Majflt 0 Inblock 32 Oublock 976608 Msgsnd 0 Msgrcv 0 Nsignals 0 Nvcsw 68925 (96.9%) Nivcsw 2198 Utime 781.762266 Stime 2.612581 Start 159119.22 Finish 159183.68
AMD IPC is just slightly lower.
Process Tree - phoronix/y-cruncher
Process Tree
The program runs two processes per virtual core.
    18152) sh
      18153) y-cruncher
        18154) y-cruncher
          18156) sh
            18157) 13-HSW ~ Airi
            18158) 13-HSW ~ Airi
            18159) 13-HSW ~ Airi
            18160) 13-HSW ~ Airi
            18161) 13-HSW ~ Airi
            18162) 13-HSW ~ Airi
            18163) 13-HSW ~ Airi
            18164) 13-HSW ~ Airi
            18165) 13-HSW ~ Airi
            18166) 13-HSW ~ Airi
            18167) 13-HSW ~ Airi
            18168) 13-HSW ~ Airi
            18169) 13-HSW ~ Airi
            18170) 13-HSW ~ Airi
            18171) 13-HSW ~ Airi
            18172) 13-HSW ~ Airi
        18155) sed
 About this graph
Some noise as these processes are scheduled on all cores.
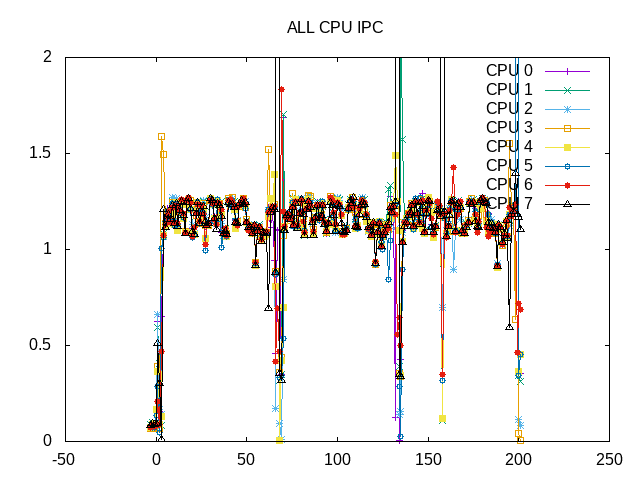
The overall IPC is consistent and slightly over 1.
 About this graph
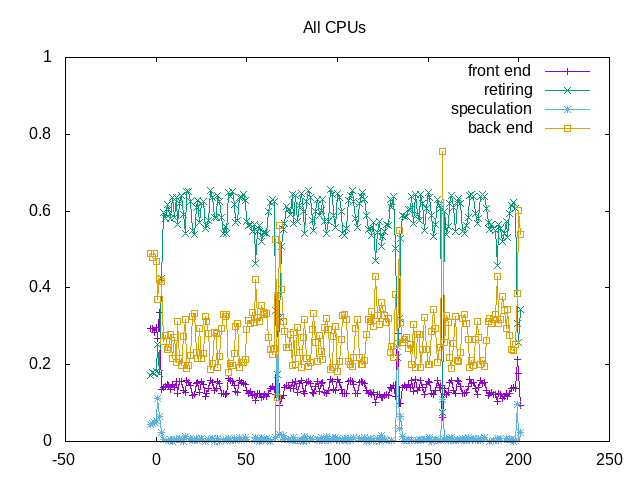
Backend stalls are the largest limiter.
retire         0.588
ms_uops                0.001
speculation    0.004
branch_misses          5.28%
machine_clears         94.72%
frontend       0.137
idq_uops_delivered_0   0.054
icache_stall               0.009
itlb_misses                0.000
idq_uops_delivered_1   0.060
idq_uops_delivered_2   0.071
idq_uops_delivered_3   0.088
dsb_ops                    55.17%
backend        0.271
resource_stalls.sb     0.033
stalls_ldm_pending     0.214
Overall retirement rate is higher than reported above (and this also seems more consistent with the IPC). Shows a few frontend stalls (branch resteers?) and some memory stalls.
Next steps: None