Metrics (Intel) - phoronix/c-rayThis is a test of C-Ray, a simple raytracer designed to test the floating-point CPU performance. This test is multi-threaded (16 threads per core), will shoot 8 rays per pixel for anti-aliasing, and will generate a 1600 x 1200 image.
c-ray - pid 12476
	On_CPU   0.988
	On_Core  7.901
	IPC      1.438
	Retire   0.740	(74.0%)
	FrontEnd 0.104	(10.4%)
	Spec     0.008	(0.8%)
	Backend  0.148	(14.8%)
	Elapsed  26.61
	Procs    130
	Minflt   2514
	Majflt   0
	Utime    210.25  	(100.0%)
	Stime    0.00    	(0.0%)
	Start    442452.65
	Finish   442479.26
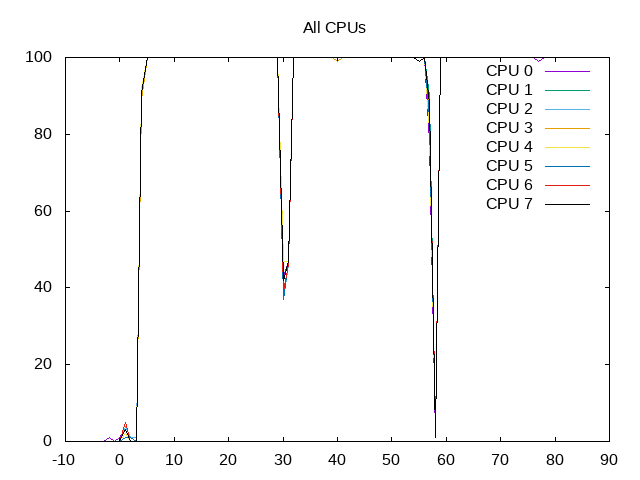
This benchmark runs for slightly less than 30 seconds. During that time it is scheduled on all cores of the CPU almost 100% of the time.
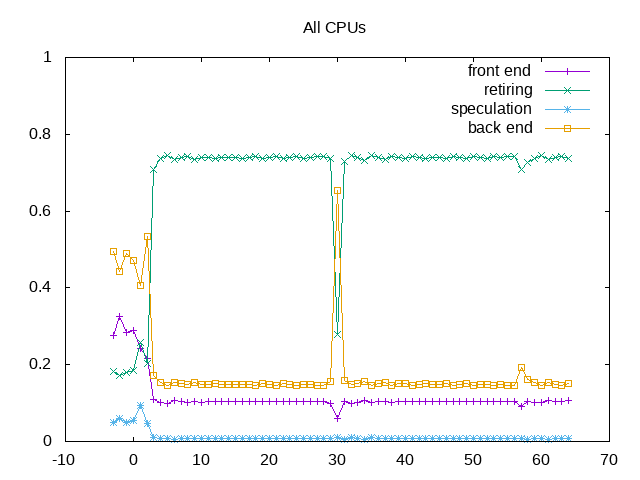
Topdown metrics show it isn’t slowed much by issues in front end, backend or bad speculation.
Metrics (AMD) - phoronix/c-raysh - pid 5058 On_CPU 0.977 On_Core 15.625 IPC 1.844 FrontCyc 0.001 (0.1%) BackCyc 0.079 (7.9%) Elapsed 11.36 Procs 258 Minflt 2925 Majflt 0 Utime 177.50 (100.0%) Stime 0.00 (0.0%) Start 40959.30 Finish 40970.66
Process Tree - phoronix/c-ray
Process Tree
A total of 130 processes are run as part of the application, it is otherwise symmetric across these processes.
 About this graph
CPU utilization shows almost even usage across all cores.

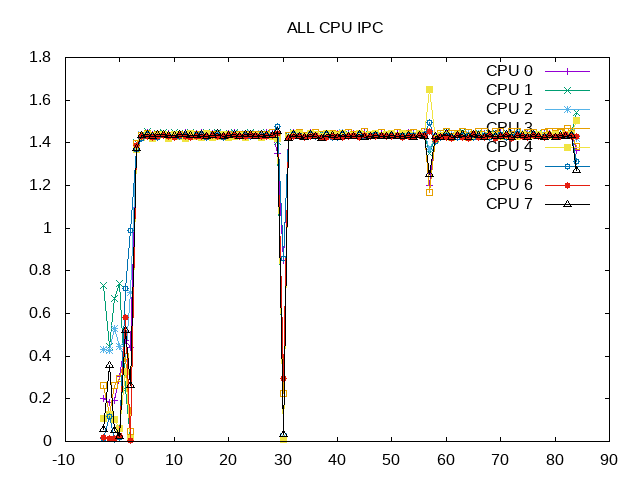
The IPC is a little over 1.4
 About this graph
The plot shows across three runs of the benchmark.
Overall, this benchmark is spending most all time scheduled on the cores and most of that time retiring instructions. No major bottlenecks stick out for further investigation, but instead this is a useful cross reference point with other workloads or other platforms.
Next step (done): Investigate why wspy runs on Ryzen occasionally miss exit events e.g. ~1 of the 256 threads launched. Investigated this and appears that the events might still occur but information such as the child pid might not always be available in a ptrace(PTRACE_GETEVENTMSG) call. I’ve made the ptrace2 engine more robust for this possibility.
