
Metrics (Intel) - phoronix/x264This is a simple test of the x264 encoder run on the CPU (OpenCL support disabled) with a sample video file.
sh - pid 3679
	On_CPU   0.713
	On_Core  5.706
	IPC      1.305
	Retire   0.691	(69.1%)
	FrontEnd 0.243	(24.3%)
	Spec     0.065	(6.5%)
	Backend  0.001	(0.1%)
	Elapsed  16.64
	Procs    13
	Minflt   38805
	Majflt   0
	Utime    94.39   	(99.4%)
	Stime    0.56    	(0.6%)
	Start    255033.45
	Finish   255050.09
The number that stands out most here is an On_CPU of only 71%. While there are enough processes to have one per core, they are not being scheduled to run on the CPU. My guess is waiting on disk I/O, but need to create/find a tool to demonstrate this. I think it also explains why my Ryzen 1700 is slower than one at Phoronix (with SSD).
Otherwise, the IPC is middle of the range with slightly higher frontend events and no waiting on backend events.
Metrics (AMD) - phoronix/x264sh - pid 13496 On_CPU 0.703 On_Core 11.255 IPC 1.320 FrontCyc 0.061 (6.1%) BackCyc 0.055 (5.5%) Elapsed 9.81 Procs 23 Minflt 41814 Majflt 0 Utime 109.78 (99.4%) Stime 0.63 (0.6%) Start 238073.56 Finish 238083.37Process Tree - phoronix/x264
Process Tree
    3679) sh elapsed=16.64 start=0.00 finish=16.64
      3680) x264 elapsed=16.63 start=0.01 finish=16.64
        3681) x264 elapsed=16.63 start=0.01 finish=16.64
        3682) x264 elapsed=16.61 start=0.03 finish=16.64
        3683) x264 elapsed=16.61 start=0.03 finish=16.64
        3684) x264 elapsed=16.61 start=0.03 finish=16.64
        3685) x264 elapsed=16.61 start=0.03 finish=16.64
        3686) x264 elapsed=16.60 start=0.04 finish=16.64
        3687) x264 elapsed=16.60 start=0.04 finish=16.64
        3688) x264 elapsed=16.60 start=0.04 finish=16.64
        3689) x264 elapsed=16.60 start=0.04 finish=16.64
        3690) x264 elapsed=16.60 start=0.04 finish=16.64
        3691) x264 elapsed=15.55 start=0.04 finish=15.59
The process tree is symmetric with a few more processes than cores.
 About this graph
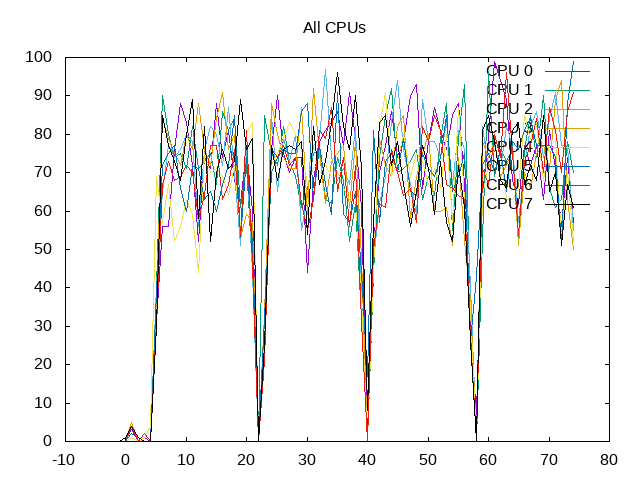
Overall usage is a little jagged as cores get scheduled and not.
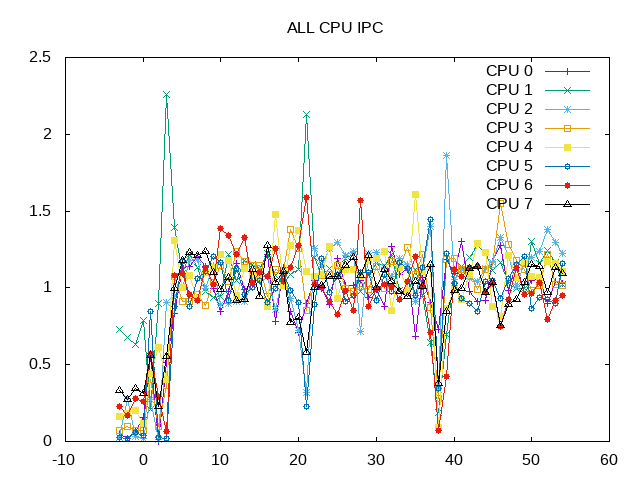
The IPC averages out to 1.32.
 About this graph
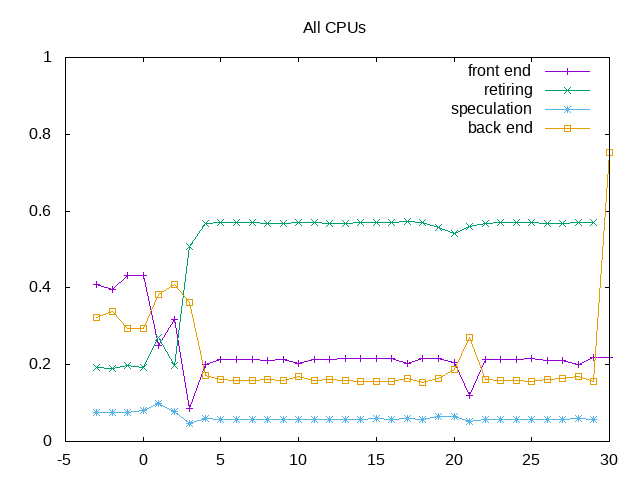
Top down analysis shows retiring ~60% of available slots.
Next steps: Find tool to validate and show hypothesis of waiting on disk I/O. Note: Have done first start of this at this link.