
Metrics (Intel) - phoronix/m-queensA solver for the N-queens problem with multi-threading support via the OpenMP library.
sh - pid 21752
	On_CPU   0.987
	On_Core  7.900
	IPC      1.194
	Retire   0.439	(43.9%)
	FrontEnd 0.057	(5.7%)
	Spec     0.452	(45.2%)
	Backend  0.051	(5.1%)
	Elapsed  202.53
	Procs    10
	Maxrss   10K
	Minflt   267
	Majflt   0
	Inblock  0
	Oublock  16
	Msgsnd   0
	Msgrcv   0
	Nsignals 0
	Nvcsw    53	(0.1%)
	Nivcsw   71110
	Utime    1599.474959
	Stime    0.420508
	Start    716588.68
	Finish   716791.21
The On_CPU is high at 99%. The level of bad speculation (branch misprediction) is also high and hence overall IPC is 1.19.
Metrics (AMD) - phoronix/m-queenssh - pid 13731 On_CPU 0.972 On_Core 15.557 IPC 1.417 FrontCyc 0.000 (0.0%) BackCyc 0.000 (0.0%) Elapsed 94.44 Procs 18 Maxrss 10K Minflt 291 Majflt 0 Inblock 0 Oublock 16 Msgsnd 0 Msgrcv 0 Nsignals 0 Nvcsw 99 (0.1%) Nivcsw 138017 Utime 1469.202748 Stime 0.009387 Start 598181.57 Finish 598276.01
IPC on AMD is slightly higher.
Process Tree - phoronix/m-queens
Process Tree
The process tree is simple.
    21752) sh
      21753) m-queens
        21754) m-queens.bin
        21755) m-queens.bin
        21756) m-queens.bin
        21757) m-queens.bin
        21758) m-queens.bin
        21759) m-queens.bin
        21760) m-queens.bin
        21761) m-queens.bin
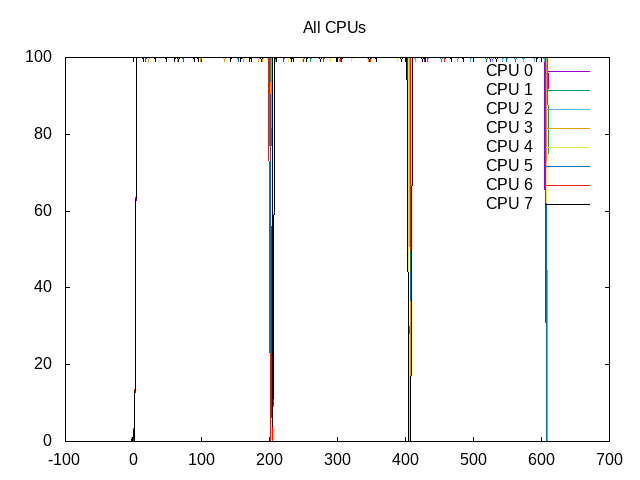 About this graph
Overall the process is scheduled 99% on all the cores.
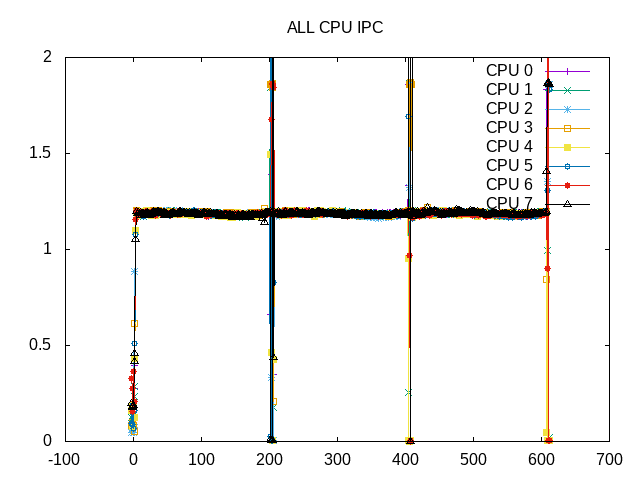
The IPC is consistent through the workload run.
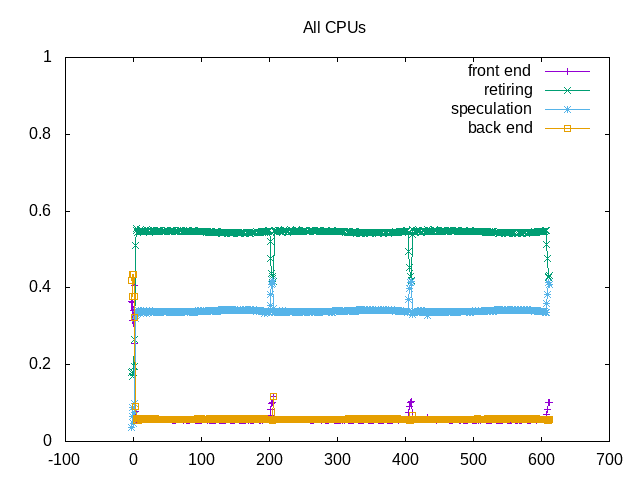 About this graph
Bad speculation is largest issue.
on_cpu         0.980
elapsed        611.872
utime          4796.697
stime          0.495
nvcsw          958 (0.45%)
nivcsw         213333 (99.55%)
inblock        0
onblock        696
retire         0.544
ms_uops                0.000
speculation    0.340
branch_misses          99.99%
machine_clears         0.01%
frontend       0.057
idq_uops_delivered_0   0.008
icache_stall               0.000
itlb_misses                0.000
idq_uops_delivered_1   0.020
idq_uops_delivered_2   0.031
idq_uops_delivered_3   0.054
dsb_ops                    114.23%
backend        0.058
resource_stalls.sb     0.000
stalls_ldm_pending     0.043
l2_refs                    0.000
l2_misses                  0.000
l2_miss_ratio              36.83%
l3_refs                    0.000
l3_misses                  0.000
l3_miss_ratio              12.90%
Bad speculation are due to branch misses. The “dsb_ops” counter for uop cache entries is somehow larger than the total number of uops, so this doesn’t look quite correct. Both backend and frontend stalls are low.
Next steps: None