
Benchmark for monitoring real time performance of the Go implementation for HTTP, JSON and garbage testing per iteration.
‘
This benchmark has four workloads. The Phoronix article only compared the json workload and that is what I’ve placed in the overall “metrics” list. However, in examples below I go through all four workloads.
Here is a comparison between my Haswell i7-4770S and Ryzen 7 1700 box in overall performance:
Intel:
1. http  -          9,537 nanoseconds/operation
2. json  -     16,334,521 nanoseconds/operation
3. build - 13,686,585,291 nanoseconds/operation
4. garbage -    3,389,072 nanoseconds/operation

AMD:
1. http  -          9,443 nanoseconds/operation
2. json  -      9,140,214 nanoseconds/operation
3. build - 16,601,937,035 nanoseconds/operation
4. garbage -    1,911,564 nanoseconds/operation
Of most interest will be the json benchmark that is otherwise compared.
Before going to the metrics, a chart to show user/system time on the four workloads.
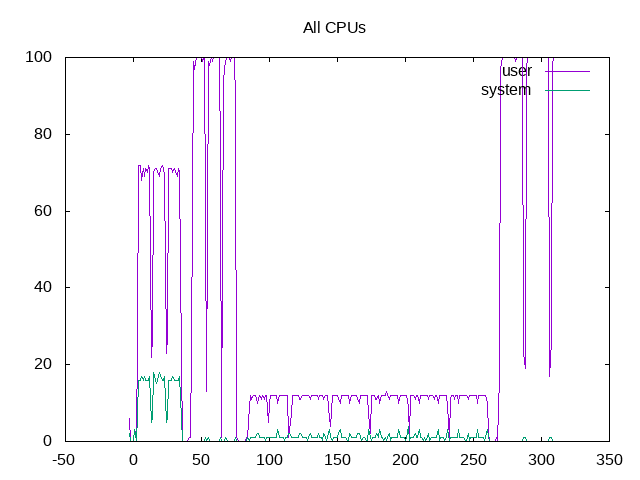
This basically shows the second workload (json) at close to 100% cpu and the http workload also close to 100% but with more system time. The build benchmark is much lower and the garbage workload again near 100%
phoronix-test-s - pid 4418
	On_CPU   0.950
	On_Core  7.603
	IPC      1.079
	Retire   0.510	(51.0%)
	FrontEnd 0.377	(37.7%)
	Spec     0.071	(7.1%)
	Backend  0.042	(4.2%)
	Elapsed  234.67
	Procs    4638
	Minflt   4821368
	Majflt   2
	Utime    1668.82 	(93.5%)
	Stime    115.36  	(6.5%)
	Start    191332.56
	Finish   191567.23
Above are the metrics for the entire test run. As compared with the chart above, there is some extra double counting going on. I’ve seen this before (threads exit and their user+system time gets accrued to their siblings resulting in double counting; and even >100% On_CPU scores that doesn’t make sense). Otherwise, the code is fairly frontend centric.
These metrics can be broken out into individual workloads
sh - pid 4650
	On_CPU   1.742
	On_Core  13.936
	IPC      0.614
	Retire   0.315	(31.5%)
	FrontEnd 0.594	(59.4%)
	Spec     0.036	(3.6%)
	Backend  0.055	(5.5%)
	Elapsed  10.18
	Procs    64
	Minflt   34192
	Majflt   0
	Utime    105.59  	(74.4%)
	Stime    36.28   	(25.6%)
	Start    191335.21
	Finish   191345.39
http – clearly the On_CPU/On_Core are bogus.
sh - pid 4845
	On_CPU   1.917
	On_Core  15.334
	IPC      1.347
	Retire   0.636	(63.6%)
	FrontEnd 0.315	(31.5%)
	Spec     0.016	(1.6%)
	Backend  0.033	(3.3%)
	Elapsed  10.13
	Procs    64
	Minflt   98981
	Majflt   0
	Utime    155.16  	(99.9%)
	Stime    0.17    	(0.1%)
	Start    191375.80
	Finish   191385.93
json also front-end heavy.and clearly bogus On_CPU.
sh - pid 5037
	On_CPU   0.113
	On_Core  0.904
	IPC      1.596
	Retire   0.670	(67.0%)
	FrontEnd 0.334	(33.4%)
	Spec     0.333	(33.3%)
	Backend  -0.337	(-33.7%)
	Elapsed  28.27
	Procs    1268
	Minflt   1363500
	Majflt   0
	Utime    24.35   	(95.3%)
	Stime    1.20    	(4.7%)
	Start    191416.25
	Finish   191444.52
Build with metrics that don’t make sense.
h - pid 8851
	On_CPU   1.865
	On_Core  14.919
	IPC      1.062
	Retire   0.507	(50.7%)
	FrontEnd 0.306	(30.6%)
	Spec     0.066	(6.6%)
	Backend  0.122	(12.2%)
	Elapsed  17.99
	Procs    65
	Minflt   95132
	Majflt   0
	Utime    268.10  	(99.9%)
	Stime    0.30    	(0.1%)
	Start    191511.27
	Finish   191529.26
garbage similar to above.
Metrics (AMD) - phoronix/go-benchmarkphoronix-test-s - pid 32312 On_CPU 0.670 On_Core 10.721 IPC 1.124 FrontCyc 0.137 (13.7%) BackCyc 0.165 (16.5%) Elapsed 232.76 Procs 4958 Minflt 5069668 Majflt 0 Utime 2319.05 (92.9%) Stime 176.45 (7.1%) Start 176363.88 Finish 176596.64
Overall AMD metrics
sh - pid 408
	On_CPU   1.853
	On_Core  29.640
	IPC      1.357
	FrontCyc 0.129	(12.9%)
	BackCyc  0.197	(19.7%)
	Elapsed  10.57
	Procs    94
	Minflt   153842
	Majflt   0
	Utime    312.64  	(99.8%)
	Stime    0.66    	(0.2%)
	Start    176407.73
	Finish   176418.30
Metrics for the json portion.
Process Tree - phoronix/go-benchmark
Process Tree
Overall process tree for all workloads.
 About this graph
The build shows some chaos, partially because much of it runs single-threaded and would be better to pin to just one or two threads.

The IPC for json is ~1.35.
 About this graph
Overall topdown metrics show how frontend bound clearly plays a role in the json workload.
Next steps: Cross-comparing with perf(1), that this benchmark is front-end heavy is consistent with perf(1). For example:
root@popayan:/var/lib/phoronix-test-suite/installed-tests/pts/go-benchmark-1.1.4# perf stat -a --topdown ./json
pkg: golang.org/x/benchmarks
goos: linux
goarch: amd64

2018/04/21 22:34:36 Benchmarking 1 iterations
2018/04/21 22:34:36 Benchmarking 100 iterations
2018/04/21 22:34:38 Benchmarking 500 iterations
# memprof=/tmp/11.prof.txt
# cpuprof=/tmp/10.prof.txt
BenchmarkJSON-8      500	  16333616 ns/op	   4904960 GC-bytes-from-system	    175262 STW-ns/GC	     36454 STW-ns/op	   7883987 allocated-bytes/op	    105444 allocs/op	 134150456 bytes-from-system	 120848384 heap-bytes-from-system	   7479608 other-bytes-from-system	 130867200 peak-RSS-bytes	 136753152 peak-VM-bytes	    917504 stack-bytes-from-system	 129950956 user+sys-ns/op

 Performance counter stats for 'system wide':

                  retiring             bad speculation      frontend bound       backend bound
S0-C0           2     62.9%                1.5%               31.6%                3.9%
S0-C1           2     63.3%                1.6%               31.1%                4.0%
S0-C2           2     63.0%                1.5%               31.5%                4.0%
S0-C3           2     63.2%                1.6%               31.1%                4.1%

      10.105945577 seconds time elapsed
So I think there are two general areas to work further: (1) improve the integrity of data in some areas like On_CPU and similar metrics. Most likely better accounting with threads to avoid double-counting and (2) drill deeper in the front-end nature of the benchmark, e.g. instruction caches, tlbs, etc. Some of this makes sense as an interpretive language, but dissect the factors and also why speculation is not a bigger factor.
According to the benchmark page larger differences between Ubuntu 16.04 (go version 1.6) and Ubuntu 18.04 (go version 1.10) most likely changes in the interpreter/compiler system.