
This test profile is a collection of Lua scripts/benchmarks run against a locally-built copy of LuaJIT upstream.
This is a single-threaded workload and all tests below have been pinned to core 1. The test itself runs “scimark.lua” which goes through the similar algorithms as scimark2 and java-scimark2. In order they are run these are:
Composite
Monte Carlo
Fast Fourier Transform
Sparse Matrix Multiply
Dense LU Matrix Factorization
Jacobi Successive Over-Relaxation
They all run within a single process so the overall metrics reported are a composite. However, in the time sequences below, one can see slightly different characteristics as the program goes through each workload.
Metrics (Intel) - phoronix/luajitsh - pid 19626 On_CPU 0.125 On_Core 1.000 IPC 2.026 Retire 0.385 (38.5%) FrontEnd 0.025 (2.5%) Spec 0.136 (13.6%) Backend 0.454 (45.4%) Elapsed 30.37 Procs 3 Minflt 13347 Majflt 0 Utime 30.35 (100.0%) Stime 0.01 (0.0%) Start 99616.02 Finish 99646.39
Overall the workload is scheduled to run 100% of the time. On average, the primary limiter seems to be backend stalls.
Metrics (AMD) - phoronix/luajitsh - pid 3564 On_CPU 0.062 On_Core 0.999 IPC 1.931 FrontCyc 0.012 (1.2%) BackCyc 0.245 (24.5%) Elapsed 33.12 Procs 3 Minflt 13343 Majflt 0 Utime 33.08 (100.0%) Stime 0.01 (0.0%) Start 405832.45 Finish 405865.57
AMD metrics show just a slightly lower composite IPC.
Process Tree - phoronix/luajit
Process Tree
The process tree is simple.
   19626) sh elapsed=30.37 start=0.00 finish=30.37
      19627) luajit elapsed=30.37 start=0.00 finish=30.37
        19628) luajit elapsed=30.37 start=0.00 finish=30.37
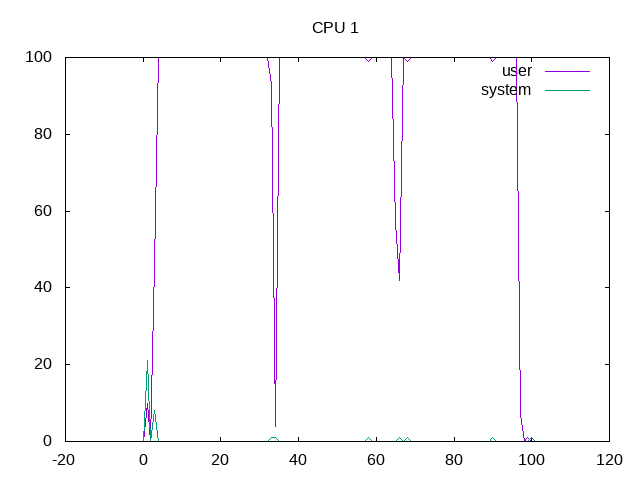
Core 1 is kept scheduled while the test runs.
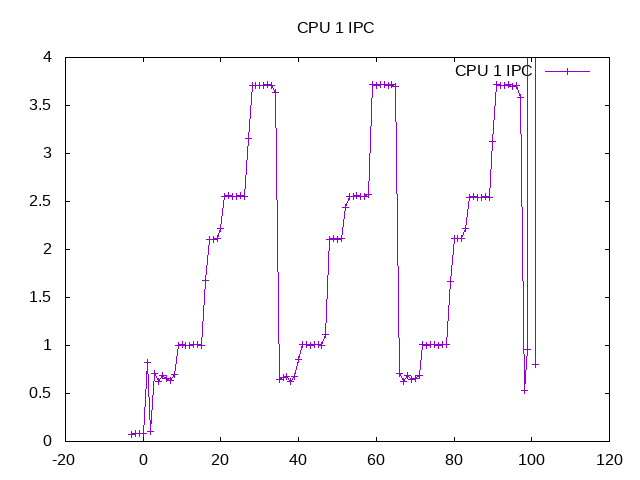
Patterns for IPC vary across from less than 1 to over 3.5 on the workloads. Running these separately would sort out the specifics.
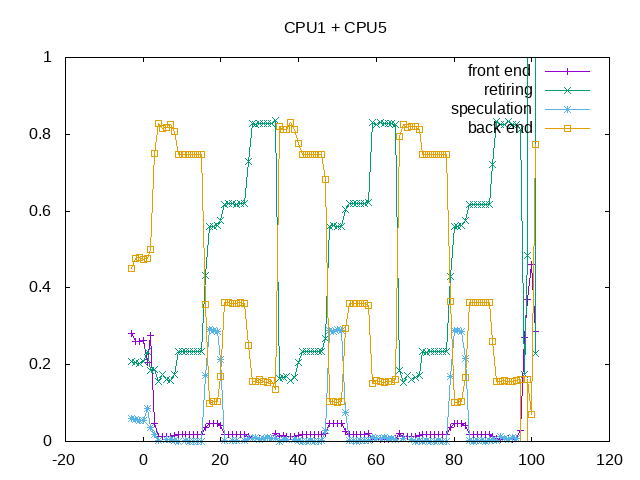
There is an almost inverse proportional relationship between backend stalls and declining IPC. One workload shows up particularly high in speculation misses.
Next steps: Separate out workloads and drill deeper into speculation misses, IPC differences between AMD/Intel and likely causes for backend stalls between core/memory. Note that there is a fair overall in all three of these between scimark2, java-scimark2 and luajit and hence can show similar patterned results.