
This is a benchmark of the Bullet Physics Engine.
This benchmark is a single-threaded benchmark with seven workloads that run in seconds. In the order they are run:
- raytests
- 3000 fall
- 1000 stack
- 1000 convex
- 136 ragdolls
- prim trimesh
- convex trimesh
These tests are all run from a single application and then summarized later. The tests supposedly report times in “seconds”, but this isn’t quite correct as the entire application runs in ~5 seconds total.
Results for 3000 fall: 4.812264
Results for 1000 stack: 5.579135
Results for 136 ragdolls: 3.058886
Results for 1000 convex: 5.174400
Results for prim-trimesh: 1.045790
Results for convex-trimesh: 1.277420
Results for raytests: 2.928500
All tests were run pinned to core 1.
The output of a run can be seen at the following link.
With these quick running tests in a single application, one can’t separate out the tests.
Metrics (Intel) - phoronix/bulletsh - pid 11861 On_CPU 0.125 On_Core 0.998 IPC 1.866 Retire 0.478 (47.8%) FrontEnd 0.067 (6.7%) Spec 0.083 (8.3%) Backend 0.372 (37.2%) Elapsed 5.11 Procs 3 Maxrss 37K Minflt 16638 Majflt 0 Inblock 0 Oublock 64 Msgsnd 0 Msgrcv 0 Nsignals 0 Nvcsw 18 (62.1%) Nivcsw 11 Utime 5.089383 Stime 0.012000 Start 652669.13 Finish 652674.24
Close to 100% of time of one core, with backend stalls the largest issue.
Metrics (AMD) - phoronix/bulletsh - pid 21387 On_CPU 0.062 On_Core 1.000 IPC 2.031 FrontCyc 0.160 (16.0%) BackCyc 0.151 (15.1%) Elapsed 4.87 Procs 3 Maxrss 37K Minflt 16642 Majflt 0 Inblock 0 Oublock 64 Msgsnd 0 Msgrcv 0 Nsignals 0 Nvcsw 18 (3.6%) Nivcsw 484 Utime 4.854848 Stime 0.013637 Start 658760.91 Finish 658765.78
Process Tree - phoronix/bullet
Process Tree
The process tree is simple
    11861) sh
      11862) bullet
        11863) AppBenchmarks
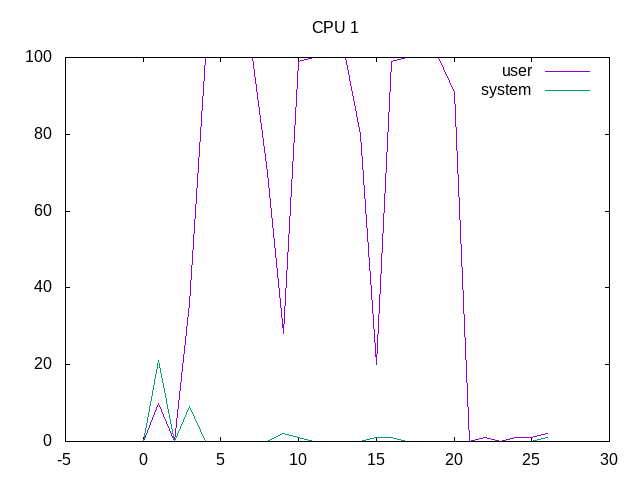
100% of time is spent running on one core.
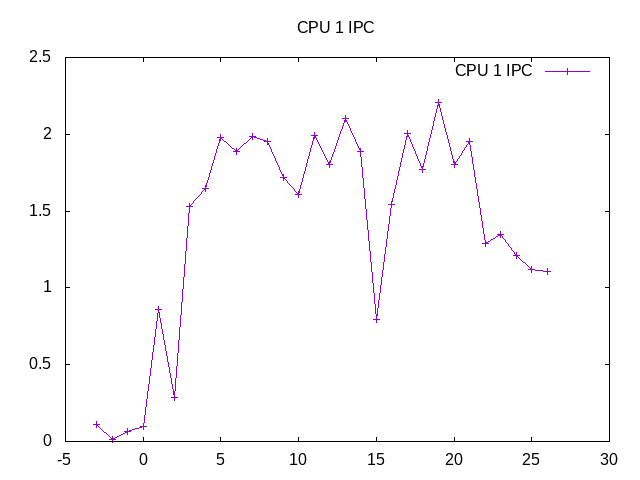
Some noise in the IPC but difficult to be certain as the benchmark runs so quickly.
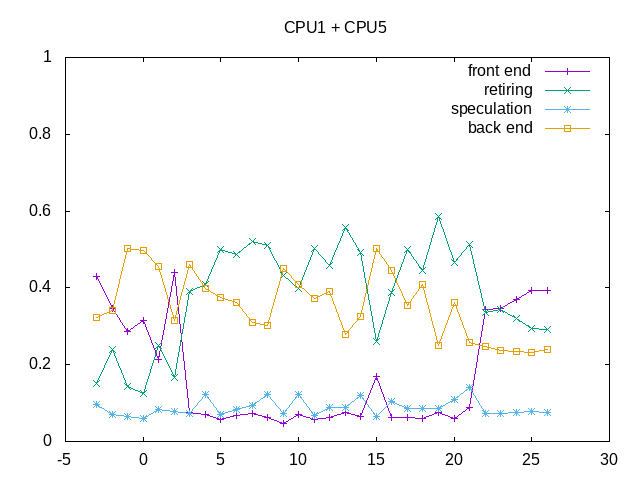
Backend stalls are the largest issue. In this plot the frontend stalls come during post-processing operations.
retire         0.256
ms_uops                0.111
speculation    0.053
branch_misses          19.85%
machine_clears         80.15%
frontend       0.288
idq_uops_delivered_0   0.117
idq_uops_delivered_1   0.140
idq_uops_delivered_2   0.160
idq_uops_delivered_3   0.184
backend        0.402
resource_stalls.sb     0.080
stalls_ldm_pending     0.554
Speculation misses appear to be primarily machine clears. The number of macro uops is also larger than average.