
Redis is an open-source data structure server.
This benchmark has five workloads. The Phoronix article only compares the set and get workloads and that is what I have in the workloads page. However, in the examples below I go through all five workloads.
Here is a comparison between my Haswell i7-4770S and Ryzen 7 1700 box in overall performance:
Intel:
1. LPOP  - 2708162.08 requests per second
2. SADD  - 2028503.79 requests per second
3. LPUSH - 1605235.71 requests per second
4. GET   - 2523369.17 requests per second
5. SET   - 1768876.54 requests per second

AMD:
1. LPOP  - 2002810.63 requests per second
2. SADD  - 1632486.67 requests per second
3. LPUSH - 1162483.04 requests per second
4. GET   - 1897628.58 requests per second
5. SET   - 1367618.97 requests per second
There is a redis benchmark page that describes it as a single-threaded in-memory database.
There are several things to note up front on the structure and functionality of redis:
Redis is *not* cpu bound
While more traditional metrics such as IPC, “topdown analysis” make sense, for a CPU-bound application this makes less sense for redis where instead times for context switches or overall latency plays a far larger role. The overall On_CPU metric is around 1% and a plot of CPU time scheduled for an entire test run shows very little time.
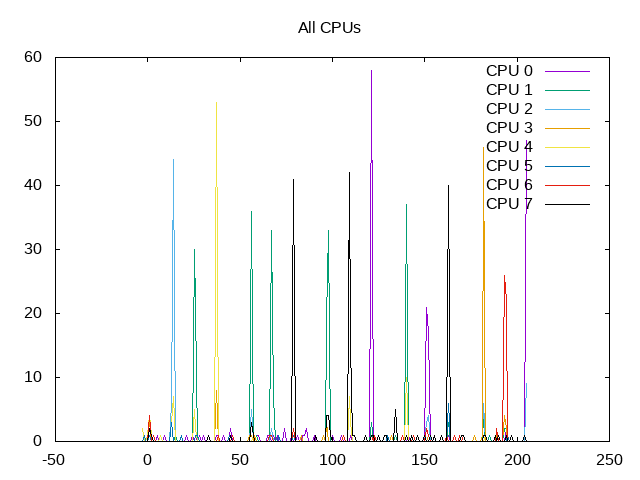 About this graph
Redis runs a fixed number of backend servers and then fires front end requests
Following is process tree for GET
    [27384] sh           cpu=3 ipc=1.74 on_cpu=0.01 on_core=0.07 elapsed=10.44 user=0.00 system=0.00
      [27385] redis        cpu=1 ipc=1.74 on_cpu=0.01 on_core=0.07 elapsed=10.44 user=0.00 system=0.00
        (27386) redis-server cpu=5 ipc=1.99 on_cpu=0.01 on_core=0.04 elapsed=10.60 user=0.37 system=0.09
          (27388) redis-server cpu=7 ipc=0.27
          (27389) redis-server cpu=2 ipc=0.31
          (27390) redis-server cpu=0 ipc=0.23
        (27387) sleep        cpu=6 ipc=0.75
        (27391) redis-benchmark cpu=5 ipc=1.32 on_cpu=0.08 on_core=0.61
        (27392) sed          cpu=6 ipc=0.62
The process tree for GET is isomorphic
    [27431] sh           cpu=2 ipc=1.87 on_cpu=0.01 on_core=0.08
      [27432] redis        cpu=3 ipc=1.87 on_cpu=0.01 on_core=0.08
        (27433) redis-server cpu=5 ipc=2.13 on_cpu=0.01 on_core=0.06
          (27435) redis-server cpu=4 ipc=0.24
          (27436) redis-server cpu=7 ipc=0.28
        (27434) sleep        cpu=0 ipc=0.77
        (27438) redis-benchmark cpu=0 ipc=1.29 on_cpu=0.06 on_core=0.49
        (27439) sed          cpu=7 ipc=0.64
Process Tree - phoronix/redisProcess Tree
These process trees show a subtle problem with more automated measurements including with a wrapper script. Following is the execution for redis.
#!/bin/sh
cd ~/redis-4.0.8/

./src/redis-server &
REDIS_SERVER_PID=$!
sleep 10

./src/redis-benchmark $@ > $LOG_FILE
kill $REDIS_SERVER_PID
sed "s/\"/ /g" -i $LOG_FILE
The script starts two server processes, sleeps for 10 seconds and then runs the benchmark program to test the server. When the program shuts down, it fires off a kill signal and creates the results. However, it doesn’t wait for that asynchronous server to stop. Hence, a simple wrapper might finish before the entire workload finishes. One can see this running this script under perf. In particular, the output from perf comes *before* the output from the databases shutting down. This is also why my traces above didn’t have closing metrics for these server processes.
mev@popayan:~/.phoronix-test-suite/installed-tests/pts/redis-1.1.0$ perf stat ./redis.mevrun0.sh -n 1000000 -P 32 -q -c 50 --csv SET
30538:C 22 Apr 10:00:26.409 # oO0OoO0OoO0Oo Redis is starting oO0OoO0OoO0Oo
30538:C 22 Apr 10:00:26.409 # Redis version=4.0.8, bits=64, commit=00000000, modified=0, pid=30538, just started
30538:C 22 Apr 10:00:26.409 # Warning: no config file specified, using the default config. In order to specify a config file use ./src/redis-server /path/to/redis.conf
30538:M 22 Apr 10:00:26.409 # You requested maxclients of 10000 requiring at least 10032 max file descriptors.
30538:M 22 Apr 10:00:26.410 # Server can't set maximum open files to 10032 because of OS error: Operation not permitted.
30538:M 22 Apr 10:00:26.410 # Current maximum open files is 4096. maxclients has been reduced to 4064 to compensate for low ulimit. If you need higher maxclients increase 'ulimit -n'.
                _._
           _.-``__ ''-._
      _.-``    `.  `_.  ''-._           Redis 4.0.8 (00000000/0) 64 bit
  .-`` .-```.  ```\/    _.,_ ''-._
 (    '      ,       .-`  | `,    )     Running in standalone mode
 |`-._`-...-` __...-.``-._|'` _.-'|     Port: 6379
 |    `-._   `._    /     _.-'    |     PID: 30538
  `-._    `-._  `-./  _.-'    _.-'
 |`-._`-._    `-.__.-'    _.-'_.-'|
 |    `-._`-._        _.-'_.-'    |           http://redis.io
  `-._    `-._`-.__.-'_.-'    _.-'
 |`-._`-._    `-.__.-'    _.-'_.-'|
 |    `-._`-._        _.-'_.-'    |
  `-._    `-._`-.__.-'_.-'    _.-'
      `-._    `-.__.-'    _.-'
          `-._        _.-'
              `-.__.-'

30538:M 22 Apr 10:00:26.410 # WARNING: The TCP backlog setting of 511 cannot be enforced because /proc/sys/net/core/somaxconn is set to the lower value of 128.
30538:M 22 Apr 10:00:26.410 # Server initialized
30538:M 22 Apr 10:00:26.410 # WARNING overcommit_memory is set to 0! Background save may fail under low memory condition. To fix this issue add 'vm.overcommit_memory = 1' to /etc/sysctl.conf and then reboot or run the command 'sysctl vm.overcommit_memory=1' for this to take effect.
30538:M 22 Apr 10:00:26.410 # WARNING you have Transparent Huge Pages (THP) support enabled in your kernel. This will create latency and memory usage issues with Redis. To fix this issue run the command 'echo never > /sys/kernel/mm/transparent_hugepage/enabled' as root, and add it to your /etc/rc.local in order to retain the setting after a reboot. Redis must be restarted after THP is disabled.
30538:M 22 Apr 10:00:26.419 * DB loaded from disk: 0.009 seconds
30538:M 22 Apr 10:00:26.419 * Ready to accept connections
./redis.mevrun0.sh: 8: ./redis.mevrun0.sh: cannot create : Directory nonexistent
30538:signal-handler (1524409236) Received SIGTERM scheduling shutdown...
sed: no input files

 Performance counter stats for './redis.mevrun0.sh -n 1000000 -P 32 -q -c 50 --csv SET':

         21.881188      task-clock (msec)         #    0.002 CPUs utilized
               108      context-switches          #    0.005 M/sec
                 1      cpu-migrations            #    0.046 K/sec
             4,271      page-faults               #    0.195 M/sec
        39,246,703      cycles                    #    1.794 GHz
        33,157,147      instructions              #    0.84  insn per cycle
         6,193,791      branches                  #  283.065 M/sec
           151,729      branch-misses             #    2.45% of all branches

      10.004613235 seconds time elapsed

mev@popayan:~/.phoronix-test-suite/installed-tests/pts/redis-1.1.0$ 30538:M 22 Apr 10:00:36.441 # User requested shutdown...
30538:M 22 Apr 10:00:36.441 * Saving the final RDB snapshot before exiting.
30538:M 22 Apr 10:00:36.508 * DB saved on disk
30538:M 22 Apr 10:00:36.508 # Redis is now ready to exit, bye bye...
I was able to get around this issue by running some of my tests by hand with perf using a modified version of the script.
#!/bin/sh
cd redis-4.0.8/

./src/redis-server &
REDIS_SERVER_PID=$!
sleep 10

./src/redis-benchmark $@ > $LOG_FILE
kill $REDIS_SERVER_PID
sed "s/\"/ /g" -i $LOG_FILE
sleep 10
Running this results in a higher total number of instructions and also a higher IPC when the redis server gets taken into account instead of just the benchmark driver process. However, it is also useful to note that this “20.007107276” elapsed time now includes 20 seconds of “sleep”, so the amount of processor time actually spent in the benchmark might be extremely small (looking through the test profile which invokes the benchmark as “-n 1000000 -P 32 -q -c 50 –csv”, only 1,000,000 requests are sent). This extremely short runtime is also why some of my metrics in the process tree above look suspect.
 Performance counter stats for './redis.mevrun.sh -n 1000000 -P 32 -q -c 50 --csv SET':

         47.668260      task-clock (msec)         #    0.002 CPUs utilized
               114      context-switches          #    0.002 M/sec
                 2      cpu-migrations            #    0.042 K/sec
             4,383      page-faults               #    0.092 M/sec
        95,880,320      cycles                    #    2.011 GHz
       206,132,871      instructions              #    2.15  insn per cycle
        37,482,101      branches                  #  786.311 M/sec
           234,095      branch-misses             #    0.62% of all branches

      20.006002954 seconds time elapsed
Next Steps:
Figure out how interesting these workloads are given that a small fraction of a second (<0.1) is spent actually doing the work that contributes to the benchmark or whether one needs to extend this further. If so, analyze these workloads from perspective of factors influencing latency, i.e. not the IPC, topdown type analysis used for cpu-bound processes.