
This test times how long it takes to build PHP 5 with the Zend engine.
An individual benchmark run takes ~100 seconds. During that time, ~44,400 mostly short quick processes are run. This makes this build process about 1/8th as large as the build-gcc workload and 1.5x larger than the build-linux-kernel. The On_CPU percentage is ~82% so while there are some sequential periods this is also mostly a parallel workload keeping the cores busy.
Metrics (Intel) - phoronix/build-phpsh - pid 27726 On_CPU 0.819 On_Core 6.552 IPC 0.768 Retire 0.378 (37.8%) FrontEnd 0.332 (33.2%) Spec 0.122 (12.2%) Backend 0.169 (16.9%) Elapsed 99.00 Procs 44411 Maxrss 450K Minflt 13820421 Majflt 0 Inblock 0 Oublock 1415056 Msgsnd 0 Msgrcv 0 Nsignals 0 Nvcsw 303470 (56.6%) Nivcsw 233106 Utime 623.132218 Stime 25.527337 Start 589839.45 Finish 589938.45
Overall metrics show an IPC of 0.77 with frontend stalls being the largest issue and the level of speculative execution also being higher. Not sure I believe the Inblock of 0 in the list above, but there is some I/O as can also be seen with ~57% voluntary context switches.
Metrics (AMD) - phoronix/build-phpsh - pid 29424 On_CPU 0.571 On_Core 9.139 IPC 0.753 FrontCyc 0.118 (11.8%) BackCyc 0.118 (11.8%) Elapsed 80.03 Procs 44411 Maxrss 450K Minflt 13907559 Majflt 0 Inblock 0 Oublock 1414952 Msgsnd 0 Msgrcv 0 Nsignals 0 Nvcsw 301119 (52.4%) Nivcsw 273760 Utime 694.810475 Stime 36.567826 Start 599345.94 Finish 599425.97
AMD metrics show the On_CPU percentage has dropped to 57% so doubling the number of cores no longer completely scales. The IPC is fairly close.
Process Tree - phoronix/build-php
Process Tree
The process tree is large to show here, so will include instead a summary of how many of each type of process.
  25821 bash
  11978 sed
   1429 rm
   1068 cat
    976 grep
    716 x86_64-linux-gn
    716 cc
    712 cc1
    396 tr
    356 mv
    141 shtool
     40 mkdir
     18 ?
      9 wc
      9 awk
      4 collect2
      3 expr
      3 cp
      2 sort
      2 ranlib
      2 php
      2 chmod
      1 time-compile-ph
      1 sh
      1 make
      1 m4
      1 ln
      1 ldconfig.real
      1 bison
      1 ar
Interestingly it shows a lot of short-lived quick bash or sed processes particularly in proportion to the number of “cc” compilations.
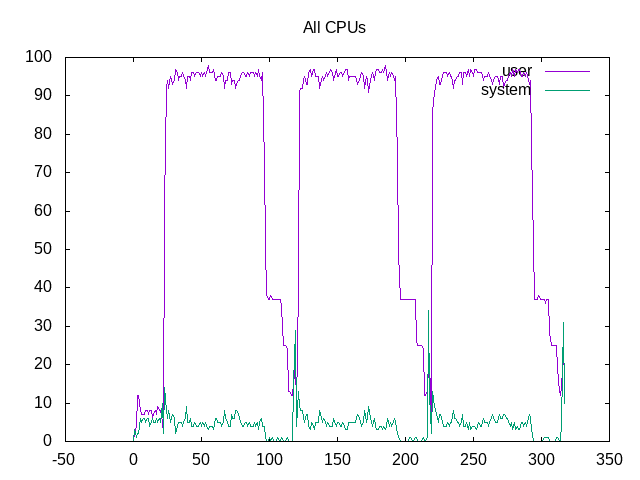
Adding up the time across all cores shows that most of the initial period is close to 100% and only at the end does the utilization drop down reducing parallel activities.
 About this graph
Breaking this amongst individual cores shows similar allocation.
 About this graph
Topdown metrics show frontend stalls as the largest limiter, with backend stalls coming during peak periods (linking phase?).
Overall topdown metrics.
retire         0.344
ms_uops                0.012
speculation    0.115
branch_misses          94.73%
machine_clears         5.27%
frontend       0.312
idq_uops_delivered_0   0.091
idq_uops_delivered_1   0.133
idq_uops_delivered_2   0.177
idq_uops_delivered_3   0.224
backend        0.228
resource_stalls.sb     0.035
stalls_ldm_pending     0.432
Still need to build out the frontend stalls beyond showing number of times with fewer than 4 uops. The speculative misses are branch misses and the backend stalls are moderate.
Next steps: Dig deeper on frontend stall issues.