
This test measures the time needed to compress a sample file (an Ubuntu file-system image) using Zstd compression.
This application is single-threaded and was measured pinned to core 1.
Metrics (Intel) - phoronix/compress-zstdsh - pid 12103 On_CPU 0.125 On_Core 1.000 IPC 0.708 Retire 0.142 (14.2%) FrontEnd 0.028 (2.8%) Spec 0.135 (13.5%) Backend 0.695 (69.5%) Elapsed 132.63 Procs 4 Maxrss 211K Minflt 53827 Majflt 0 Inblock 0 Oublock 1596880 Msgsnd 0 Msgrcv 0 Nsignals 0 Nvcsw 3261 (48.8%) Nivcsw 3423 Utime 132.036394 Stime 0.591996 Start 528075.63 Finish 528208.26
On_Core of 100%. Otherwise an IPC of 0.71 with a high rate of backend stalls. As shown below these are most likely memory related.
Metrics (AMD) - phoronix/compress-zstdsh - pid 8564 On_CPU 0.062 On_Core 0.999 IPC 0.589 FrontCyc 0.132 (13.2%) BackCyc 0.066 (6.6%) Elapsed 165.52 Procs 4 Maxrss 211K Minflt 53830 Majflt 0 Inblock 0 Oublock 1596880 Msgsnd 0 Msgrcv 0 Nsignals 0 Nvcsw 3268 (14.6%) Nivcsw 19191 Utime 164.822151 Stime 0.539489 Start 411133.23 Finish 411298.75
IPC on AMD is slightly lower.
Process Tree - phoronix/compress-zstd
Process Tree
The process tree is simple:
   12103) sh
      12104) compress-zstd
        12105) zstd
        12106) zstd
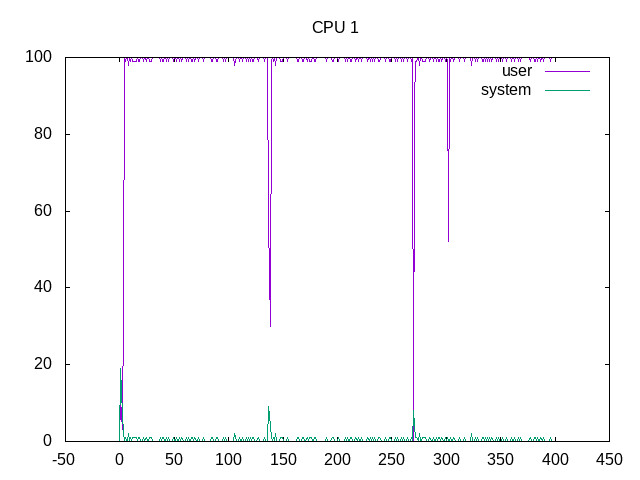
Overall On_Core is 100%.
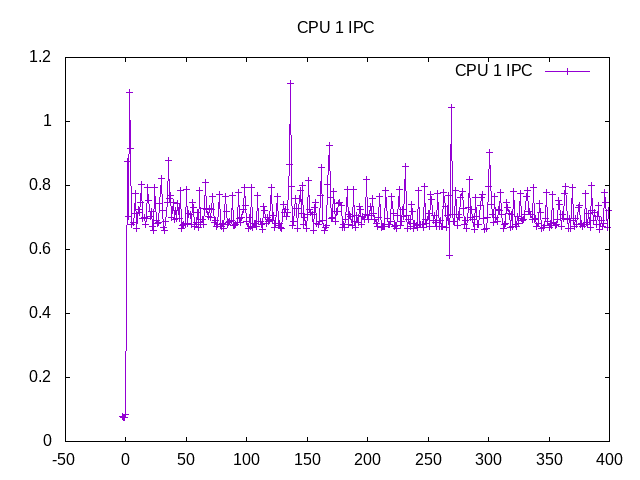
IPC has some noise, but otherwise is lower than average for a single-threaded application.
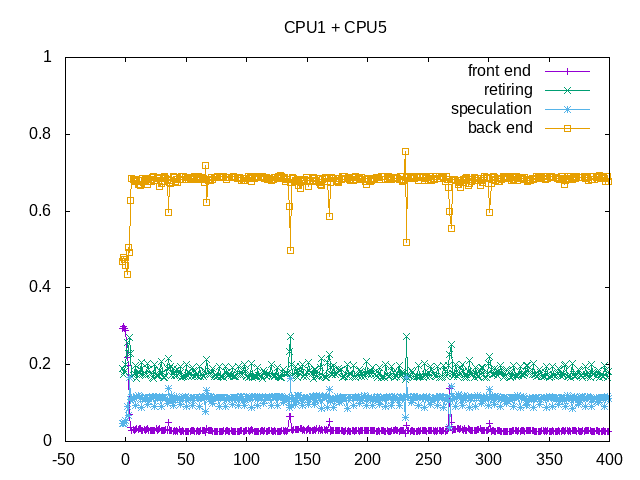
The largest issue are memory stalls.
on_cpu         0.124
elapsed        399.644
utime          395.101
stime          2.136
nvcsw          5834 (91.47%)
nivcsw         544 (8.53%)
inblock        0
onblock        4791272
retire         0.178
ms_uops                0.002
speculation    0.109
branch_misses          88.62%
machine_clears         11.38%
frontend       0.031
idq_uops_delivered_0   0.006
icache_stall               0.001
itlb_misses                0.000
idq_uops_delivered_1   0.010
idq_uops_delivered_2   0.017
idq_uops_delivered_3   0.029
dsb_ops                    90.05%
backend        0.682
resource_stalls.sb     0.003
stalls_ldm_pending     0.788
l2_refs                    0.007
l2_misses                  0.005
l2_miss_ratio              74.75%
l3_refs                    0.005
l3_misses                  0.002
l3_miss_ratio              39.00%
Cache misses and memory operations are behind the memory stalls. Branch misses are a secondary issue.
Next steps: None