
The Partnership for Advanced Computing in Europe (PRACE) has a Unified European Applications Benchmark Suite including this example for gromacs.
This benchmark seems to be more regularly updated, which will allow me to use a more recent version of gromacs than one used in the lysozyme in water tutorial. This is helpful because the newer versions of Gromacs came after Ryzen was released and hence have better defaults for the platform. The only potential downside is if the working sizes are larger than for my single node systems.
The benchmark run instructions include a “-maxh 0.50” option which terminates the computation after 30 minutes. I have added this to my runs as well though the ion channel workload completes in 396 seconds. This does mean that AMD and Intel might differ in how much work gets done on the lignocellulose workload.
Some things are in common across both workloads
- On_CPU is close to 100%
- Frontend stall slots are somewhat more than 10% and appear to be more bandwidth (bad packing) than icache or itlb misses
- Backend stall slots are 30-40% and seem like memory misses. Interestingly analysis with fewer atoms (ion channel) seems to have fewer backend stalls than the larger simulation (lignocellulose)
- Speculative misses look like 10% in one metric but less than 2% in the per process metrics/graphs, perhaps something in the measurements (e.g. idle time or something else?)
ion channel workload
Metrics (Intel) - gromacs/prace/ion
run_ion.sh - pid 7481
	On_CPU   0.994
	On_Core  7.952
	IPC      0.892
	Retire   0.378	(37.8%)
	FrontEnd 0.103	(10.3%)
	Spec     0.102	(10.2%)
	Backend  0.417	(41.7%)
	Elapsed  394.96
	Procs    9
	Maxrss   276K
	Minflt   102522
	Majflt   0
	Inblock  0
	Oublock  64
	Msgsnd   0
	Msgrcv   0
	Nsignals 0
	Nvcsw    3069	(13.0%)
	Nivcsw   20538
	Utime    3139.521124
	Stime    1.175834
	Start    63379.56
	Finish   63774.52
Runtime of six and a half minutes, some I/O but overall On_CPU is very close to 100%. The IPC of this workload is slightly lower and backend stalls are higher than other gromacs workloads. Speculative misses differ from shown in the graph or process metric.
Metrics (AMD) - gromacs/prace/ionrun_ion.sh - pid 1988 On_CPU 0.985 On_Core 15.768 IPC 1.123 FrontCyc 0.000 (0.0%) BackCyc 0.000 (0.0%) Elapsed 268.15 Procs 17 Maxrss 380K Minflt 163967 Majflt 99 Inblock 26800 Oublock 64 Msgsnd 0 Msgrcv 0 Nsignals 0 Nvcsw 20305 (4.6%) Nivcsw 418397 Utime 4226.525914 Stime 1.551173 Start 201.66 Finish 469.81
These metrics are a good contrast with the lysozyme tutorial in that the AMD IPC is now higher than the Intel IPC and both the elapsed time and reported ns/day are also proportionally higher.
Process Tree - gromacs/prace/ion
Process Tree
The process tree is simple.
7481) run_ion.sh
  7484) gmx
  7486) gmx
  7487) gmx
  7488) gmx
  7489) gmx
  7490) gmx
  7491) gmx
  7492) gmx
The logfile tells me
Using 1 MPI thread
Using 8 OpenMP threads
while the AMD configuration is using 16 MPI threads and 1 OpenMP thread. However, performance on AMD is same or slightly higher for the multiple MPI threads than a single MPI thread. The AMD performance isn’t quite double Intel whereas this is the case in other benchmarks.
 About this graph
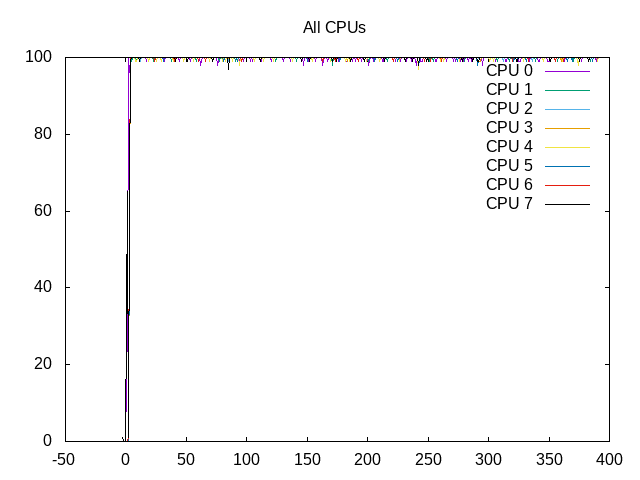
Shows the Cores are scheduled almost 100% of the time.
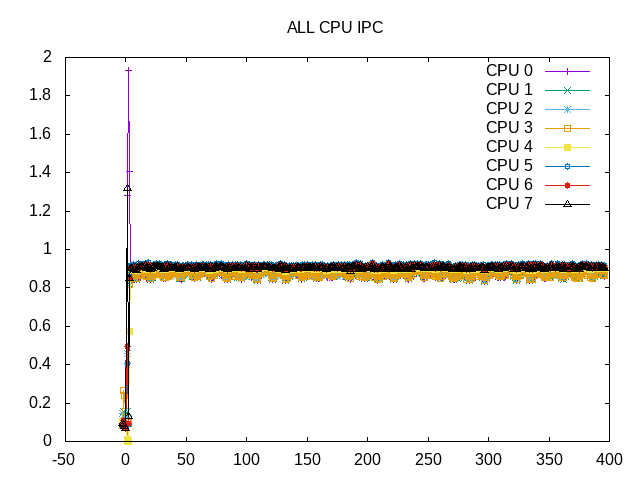
IPC is very consistent across cores and across time.
 About this graph
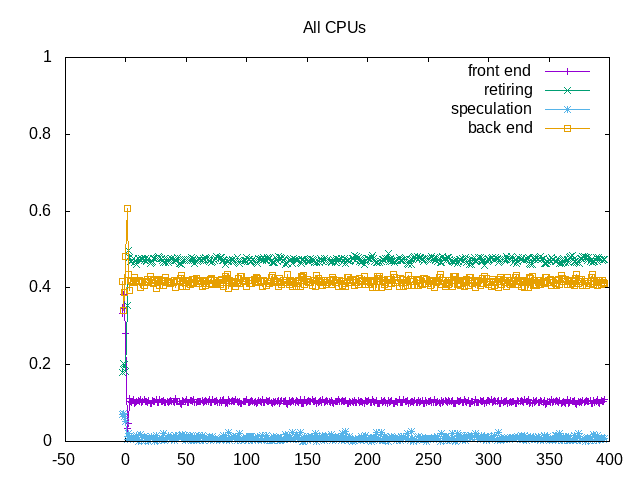
Topdown metrics also consistent across time. So probably fine to get performance samples using fewer steps.
on_cpu         0.994
elapsed        392.832
utime          3122.764
stime          1.081
nvcsw          2694 (11.06%)
nivcsw         21667 (88.94%)
inblock        0
onblock        64
retire         0.473
ms_uops                0.008
speculation    0.008
branch_misses          5.66%
machine_clears         94.34%
frontend       0.104
idq_uops_delivered_0   0.044
icache_stall               0.002
itlb_misses                0.000
idq_uops_delivered_1   0.048
idq_uops_delivered_2   0.054
idq_uops_delivered_3   0.062
dsb_ops                    79.30%
backend        0.416
resource_stalls.sb     0.094
stalls_ldm_pending     0.310
l2_refs                    0.020
l2_misses                  0.009
l2_miss_ratio              45.24%
l3_refs                    0.007
l3_misses                  0.002
l3_miss_ratio              29.88%
While the frontend stalls are ~10%, a majority of these come from 1-3 uops rather than 0, this says more an issue of bandwidth than itlb/icache misses. The uop cache gets used for almost 80% of the uops. The backend stalls correlate with memory miss rates for the caches.
lignocellulose workload
Metrics (Intel) - gromacs/prace/lignocellulose
run_lignocellul - pid 7801
	On_CPU   0.994
	On_Core  7.952
	IPC      1.114
	Retire   0.459	(45.9%)
	FrontEnd 0.122	(12.2%)
	Spec     0.134	(13.4%)
	Backend  0.285	(28.5%)
	Elapsed  1823.98
	Procs    9
	Maxrss   3567K
	Minflt   3104334
	Majflt   0
	Inblock  0
	Oublock  311008
	Msgsnd   0
	Msgrcv   0
	Nsignals 0
	Nvcsw    27453	(22.8%)
	Nivcsw   93173
	Utime    14498.313559
	Stime    5.504345
	Start    66015.52
	Finish   67839.50
The elapsed time is just over 30 minutes. This seems to be because of the time limit (30 minutes) rather than the number of steps (10,000) as the logfile says 2650 steps were completed. Similar to the ion channel run, the On_CPU is almost 100%. The IPC is higher and the backend stalls are lower.
Metrics (AMD) - gromacs/prace/lignocelluloserun_lignocellul - pid 2016 On_CPU 0.987 On_Core 15.788 IPC 1.220 FrontCyc 0.000 (0.0%) BackCyc 0.000 (0.0%) Elapsed 1818.66 Procs 17 Maxrss 5858K Minflt 5064327 Majflt 4 Inblock 384 Oublock 155552 Msgsnd 0 Msgrcv 0 Nsignals 0 Nvcsw 126434 (4.3%) Nivcsw 2783967 Utime 28697.746891 Stime 15.419367 Start 479.90 Finish 2298.56
Again the IPC on AMD is slightly higher than for Intel.
Process Tree - gromacs/prace/lignocelluloseProcess Tree
7801) run_lignocellul
  7803) gmx
  7804) gmx
  7805) gmx
  7806) gmx
  7807) gmx
  7808) gmx
  7809) gmx
  7810) gmx
The process tree is identical.
 About this graph
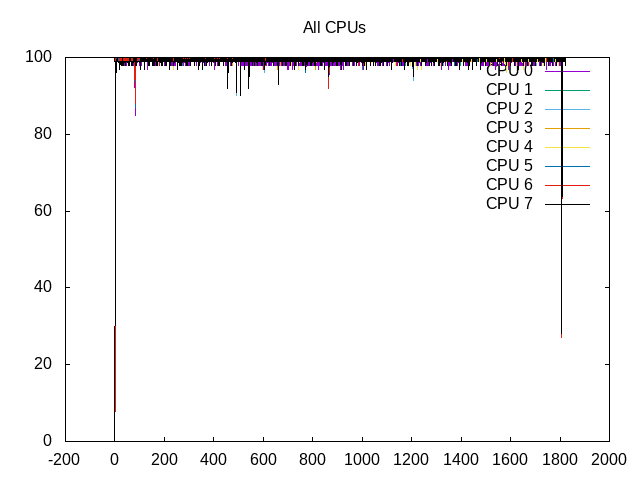
Cores are scheduled almost 100%.
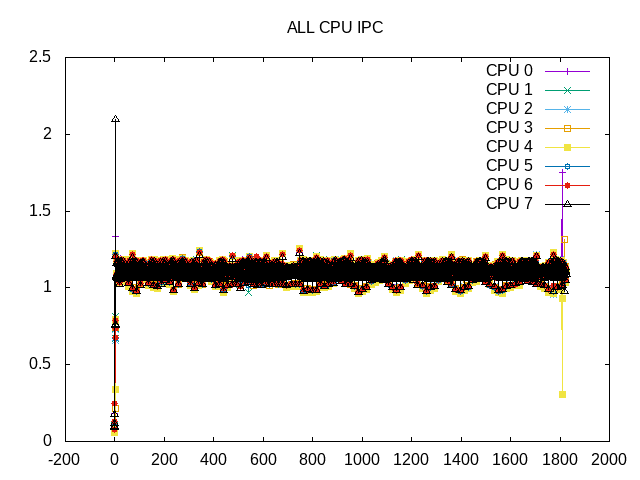
IPC is consistent across time and cores.
 About this graph
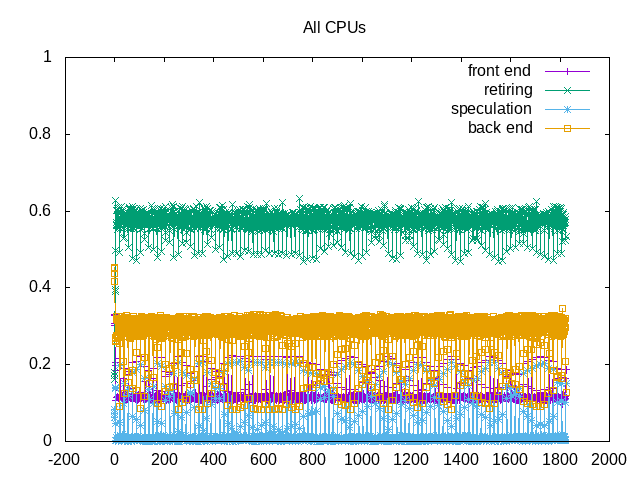
Topdown metrics show some noise blur but are otherwise consistent.
on_cpu         0.994
elapsed        1824.866
utime          14500.964
stime          4.928
nvcsw          32993 (24.49%)
nivcsw         101741 (75.51%)
inblock        0
onblock        311008
retire         0.571
ms_uops                0.002
speculation    0.019
branch_misses          35.00%
machine_clears         65.00%
frontend       0.122
idq_uops_delivered_0   0.054
icache_stall               0.001
itlb_misses                0.000
idq_uops_delivered_1   0.058
idq_uops_delivered_2   0.062
idq_uops_delivered_3   0.070
dsb_ops                    92.13%
backend        0.288
resource_stalls.sb     0.023
stalls_ldm_pending     0.229
l2_refs                    0.032
l2_misses                  0.006
l2_miss_ratio              17.84%
l3_refs                    0.004
l3_misses                  0.002
l3_miss_ratio              37.94%
Compared with the ion_channel workload, an even higher usage of the uop cache. Backend stalls and memory misses slightly lower and IPC is higher.