
Metrics (Intel) - phoronix/tensorflowThis is a benchmark of the Tensorflow deep learning framework using the CIFAR10 data set.
sh - pid 20011
	On_CPU   0.873
	On_Core  6.987
	IPC      1.062
	Retire   0.559	(55.9%)
	FrontEnd 0.101	(10.1%)
	Spec     0.025	(2.5%)
	Backend  0.315	(31.5%)
	Elapsed  91.25
	Procs    50
	Maxrss   623K
	Minflt   20401674
	Majflt   0
	Inblock  16
	Oublock  397768
	Msgsnd   0
	Msgrcv   0
	Nsignals 0
	Nvcsw    1043029	(83.0%)
	Nivcsw   213430
	Utime    591.999773
	Stime    45.550762
	Start    753175.79
	Finish   753267.04
The program has a steady amount of kernel time as well as user time ans some output I/O leaving an On_CPU of 87%. The largest limiters are backend stalls.
Metrics (AMD) - phoronix/tensorflowsh - pid 16175 On_CPU 0.722 On_Core 11.546 IPC 0.891 FrontCyc 0.017 (1.7%) BackCyc 0.050 (5.0%) Elapsed 80.41 Procs 214 Maxrss 842K Minflt 20562855 Majflt 0 Inblock 8 Oublock 397680 Msgsnd 0 Msgrcv 0 Nsignals 0 Nvcsw 1631884 (85.8%) Nivcsw 269298 Utime 851.494691 Stime 76.885744 Start 2520.93 Finish 2601.34
IPC for AMD is ~10% lower than Intel.
Process Tree - phoronix/tensorflow
Process Tree
Multiple python processes started on each core
   20011) sh
      20012) tensorflow
        20013) python3
          20021) ldconfig.real
          20022) sh
            20023) uname
        20014) python3
        20015) python3
        20016) python3
        20017) python3
        20018) python3
        20019) python3
        20020) python3
        20024) python3
        20025) python3
        20026) python3
        20027) python3
        20028) python3
        20029) python3
        20030) python3
        20031) python3
        20032) python3
        20033) python3
        20034) python3
        20035) python3
        20036) python3
        20037) python3
        20038) python3
        20039) python3
        20040) python3
        20041) python3
        20042) python3
        20043) python3
        20044) python3
        20045) python3
        20046) python3
        20047) python3
        20048) python3
        20049) python3
        20050) python3
        20051) python3
        20052) python3
        20053) python3
        20054) python3
        20055) python3
        20056) python3
        20057) python3
        20058) python3
        20059) python3
        20060) python3
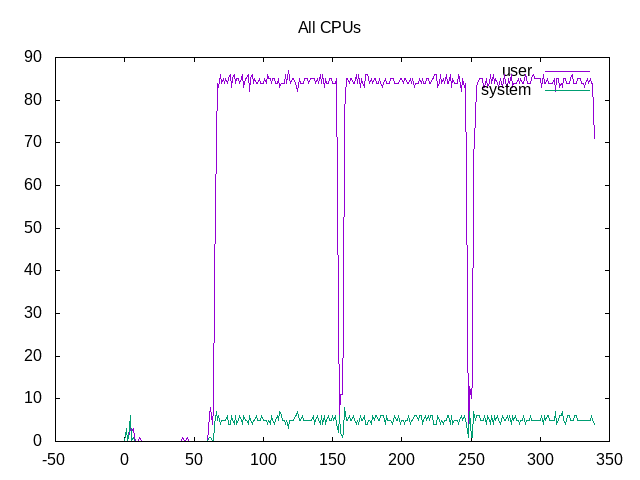
Adding times for all the CPUs shows a small amount of system time.
 About this graph
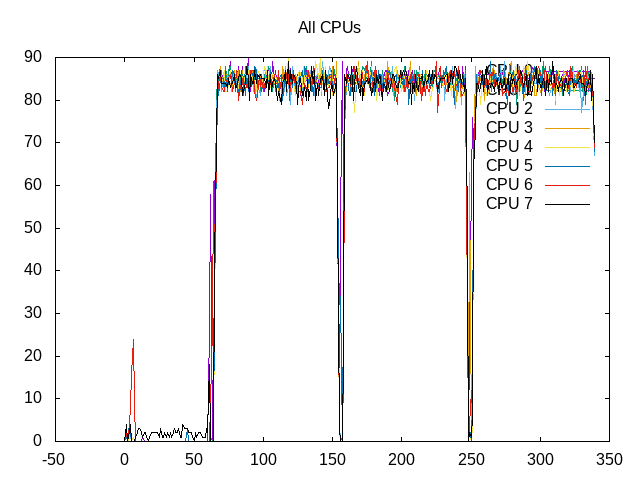
Overall scheduled on all cores.
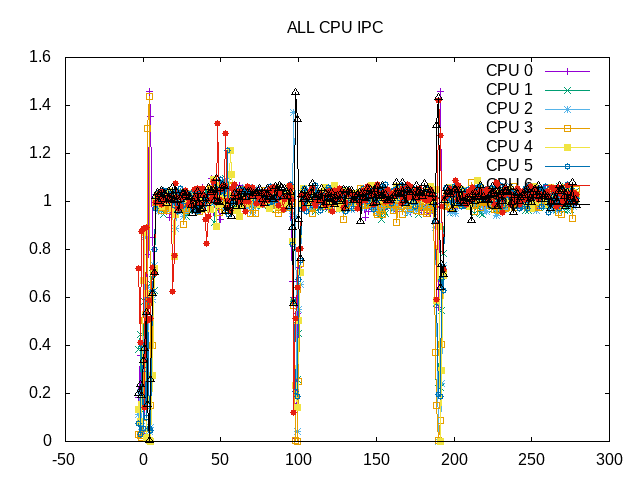
IPC is consistently around 1.
 About this graph
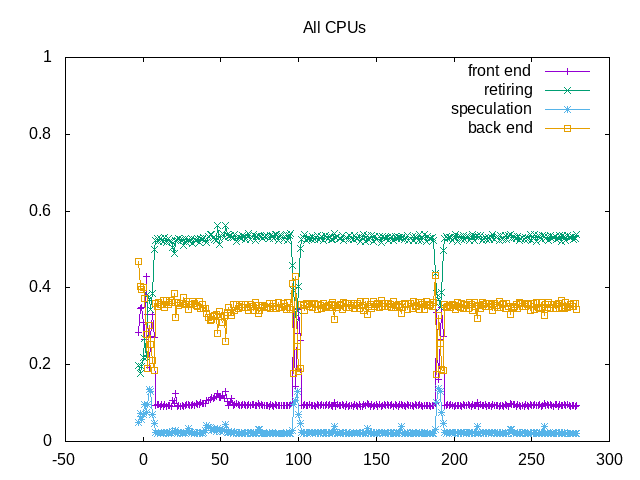
Shows how backend stalls are the largest issue.
retire         0.526
ms_uops                0.016
speculation    0.024
branch_misses          16.70%
machine_clears         83.30%
frontend       0.099
idq_uops_delivered_0   0.035
idq_uops_delivered_1   0.042
idq_uops_delivered_2   0.052
idq_uops_delivered_3   0.067
backend        0.351
resource_stalls.sb     0.109
stalls_ldm_pending     0.319
Backend stalls tend to dominate.
Next steps: Dig deeper in backend stalls.