
This test is a quick-running survey of general R performance
This test runs through different functionality for R. Following is an example output
prompt% Rscript R-benchmark-25/R-benchmark-25.R
Loading required package: Matrix


   R Benchmark 2.5
   ===============
Number of times each test is run__________________________:  3

   I. Matrix calculation
   ---------------------
Creation, transp., deformation of a 2500x2500 matrix (sec):  0.608666666666667
2400x2400 normal distributed random matrix ^1000____ (sec):  0.433
Sorting of 7,000,000 random values__________________ (sec):  0.615333333333333
2800x2800 cross-product matrix (b = a' * a)_________ (sec):  1.544
Linear regr. over a 3000x3000 matrix (c = a \ b')___ (sec):  1.01233333333333
                      --------------------------------------------
                 Trimmed geom. mean (2 extremes eliminated):  0.723776535235577

   II. Matrix functions
   --------------------
FFT over 2,400,000 random values____________________ (sec):  0.277333333333335
Eigenvalues of a 640x640 random matrix______________ (sec):  0.377666666666666
Determinant of a 2500x2500 random matrix____________ (sec):  0.806666666666667
Cholesky decomposition of a 3000x3000 matrix________ (sec):  0.669333333333334
Inverse of a 1600x1600 random matrix________________ (sec):  0.819
                      --------------------------------------------
                Trimmed geom. mean (2 extremes eliminated):  0.588592973646687

   III. Programmation
   ------------------
3,500,000 Fibonacci numbers calculation (vector calc)(sec):  0.443
Creation of a 3000x3000 Hilbert matrix (matrix calc) (sec):  0.227666666666667
Grand common divisors of 400,000 pairs (recursion)__ (sec):  0.202999999999998
Creation of a 500x500 Toeplitz matrix (loops)_______ (sec):  0.221333333333334
Escoufier's method on a 45x45 matrix (mixed)________ (sec):  0.230999999999995
                      --------------------------------------------
                Trimmed geom. mean (2 extremes eliminated):  0.226631053612893


Total time for all 15 tests_________________________ (sec):  8.48933333333333
Overall mean (sum of I, II and III trimmed means/3)_ (sec):  0.458753788177352
                      --- End of test ---
Phoronix reports the total for all tests.
The benchmark is single-threaded and all tests below were run pinned to core 1.
Metrics (Intel) - phoronix/rbenchmarksh - pid 1780 On_CPU 0.125 On_Core 1.000 IPC 2.031 Retire 0.536 (53.6%) FrontEnd 0.048 (4.8%) Spec 0.034 (3.4%) Backend 0.381 (38.1%) Elapsed 46.62 Procs 12 Maxrss 469K Minflt 1007055 Majflt 0 Inblock 0 Oublock 32 Msgsnd 0 Msgrcv 0 Nsignals 0 Nvcsw 83 (50.6%) Nivcsw 81 Utime 45.792221 Stime 0.826306 Start 747465.67 Finish 747512.29
The program runs On_Core 100% of the time. The largest limitations are backend stalls.
Metrics (AMD) - phoronix/rbenchmarksh - pid 7574 On_CPU 0.062 On_Core 0.999 IPC 2.069 FrontCyc 0.018 (1.8%) BackCyc 0.319 (31.9%) Elapsed 128.13 Procs 12 Maxrss 468K Minflt 1005211 Majflt 0 Inblock 0 Oublock 40 Msgsnd 0 Msgrcv 0 Nsignals 0 Nvcsw 84 (0.7%) Nivcsw 12624 Utime 126.888282 Stime 1.132180 Start 757668.18 Finish 757796.31
IPC on AMD is also close.
Process Tree - phoronix/rbenchmark
Process Tree
The process tree is simple.
    1780) sh
      1781) rbenchmark
        1782) which
        1783) R
          1784) uname
          1785) R
            1788) R
            1789) sed
            1790) sed
          1793) sh
            1794) rm
        1797) Rscript

The On_Core percentage is 100% with some system time spent.
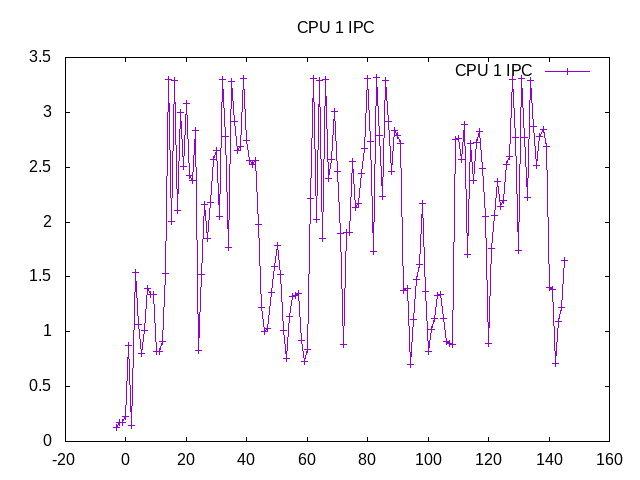
Some noise in the IPC as the benchmark goes through different subtests.

Most all the IPC noise is correlated with backend stalls.
retire         0.534
ms_uops                0.033
speculation    0.040
branch_misses          77.52%
machine_clears         22.48%
frontend       0.043
idq_uops_delivered_0   0.011
idq_uops_delivered_1   0.015
idq_uops_delivered_2   0.023
idq_uops_delivered_3   0.036
backend        0.383
resource_stalls.sb     0.013
stalls_ldm_pending     0.592
Backend stalls appear to be memory related.
Next steps: None