
This test times how long it takes to build the LLVM compiler stack.
This test has many similarities with other “build-*” benchmarks. One difference among them is the percentage of On_CPU time where build-llvm is the closest to 100%:
build-llvm         - 98%
build-linux-kernel - 88%
build-php          - 82%
build-gcc          - 72%
These percentages reflect the amount of parallel vs. sequential stages during the particular build. For example, a single-threaded link step or command run on only one core. The percentages are on my 8 hyper-thread cores and drop as the number of cores increase. So this benchmark should be a good one to show scaling on multi-core systems.
Metrics (Intel) - phoronix/build-llvmsh - pid 17292 On_CPU 0.991 On_Core 7.929 IPC 0.636 Retire 0.249 (24.9%) FrontEnd 0.416 (41.6%) Spec 0.151 (15.1%) Backend 0.184 (18.4%) Elapsed 888.03 Procs 13455 Maxrss 1032K Minflt 124659157 Majflt 0 Inblock 0 Oublock 3075808 Msgsnd 0 Msgrcv 0 Nsignals 0 Nvcsw 107824 (14.9%) Nivcsw 615067 Utime 6782.665598 Stime 258.845909 Start 100993.75 Finish 101881.78
Other metrics in common include an IPC 0.64, slightly lower than others in the 0.73 to 0.87 range. Frontend stalls dominate including ITLB, iCache and bad packing. The elapsed time is almost 15 minutes.
Metrics (AMD) - phoronix/build-llvmbuild-llvm - pid 30824 On_CPU 0.974 On_Core 15.591 IPC 0.578 FrontCyc 0.000 (0.0%) BackCyc 0.000 (0.0%) Elapsed 546.59 Procs 13468 Maxrss 1032K Minflt 124673831 Majflt 0 Inblock 0 Oublock 3075800 Msgsnd 0 Msgrcv 0 Nsignals 0 Nvcsw 112311 (9.9%) Nivcsw 1019510 Utime 8168.007700 Stime 353.824022 Start 965340.70 Finish 965887.29
On_CPU remains high. IPC is similar.
Process Tree - phoronix/build-llvm
Process Tree
The process tree includes 13,455 processes, a bit too large to reproduce here. This compared to build-gcc (353,000), build-linux-kernel (29,000), build-php (44,000). However, the number of processes per second of elapsed time is also lower:
                    processes seconds   proc/sec
build-llvm           13455     888         15.1
build-linux-kernel   29135     160        182
build-php            44411      99        448
build-gcc           353475    1321        267
I think this reflects several things (a) build-llvm uses cmake and thus fewer small helper processes are spawned than the other make-based builds (b) the file sizes being compiled are likely larger and C++ code rather than C code (c) higher On_CPU.

Adding all cores, shows system is kept busy throughout the build.
 About this graph
Same thing breaking it out by core.
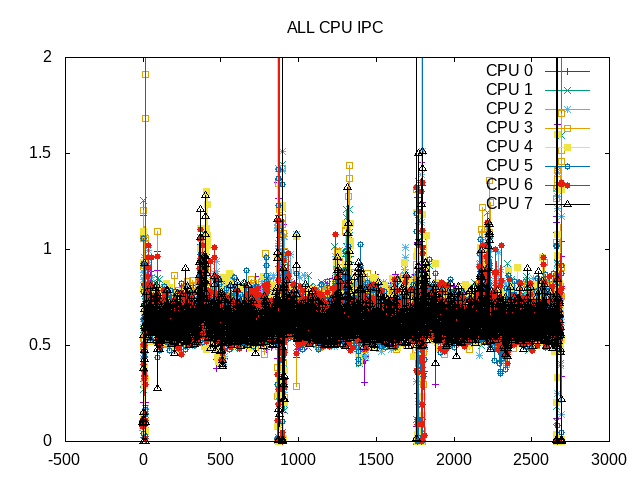
IPC has some noise but otherwise in a narrow range.
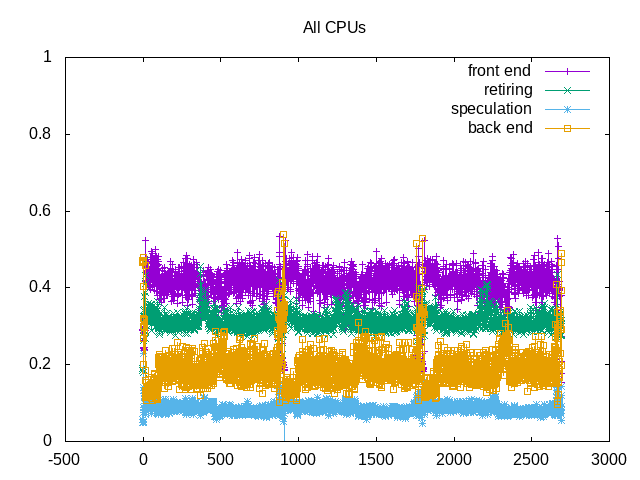 About this graph
Frontend stalls dominate.

Looks like occasionally gets close to committed memory. Does this require more time from the VM system to manage?
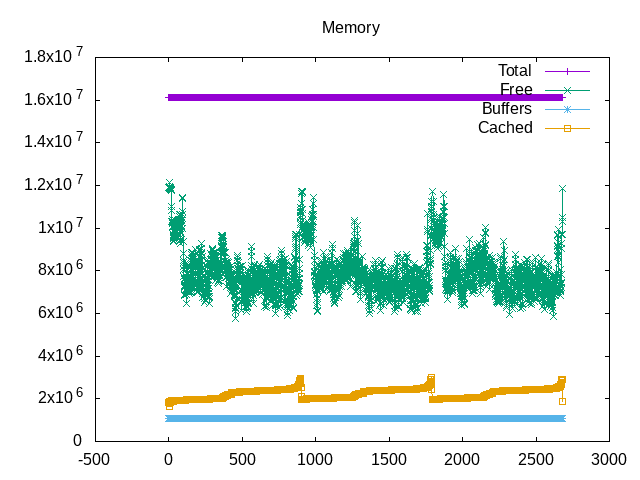
However, there is still plenty of free memory through the compilation. The cached files slowly rise to end of the build.
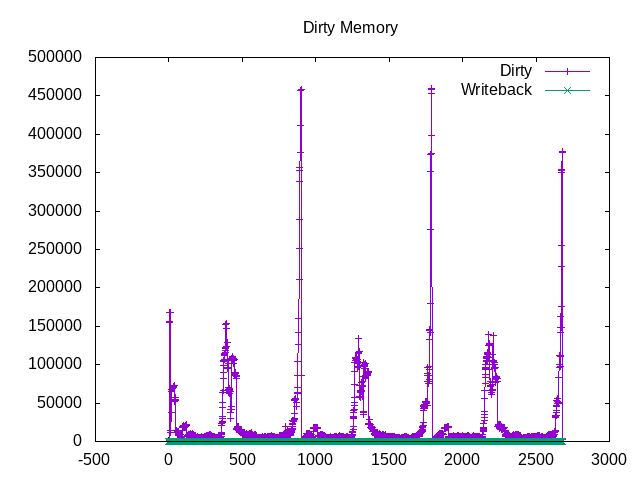
Looking at pages written to disk are not particularly large, but do show the link steps.
on_cpu         0.979
elapsed        2700.594
utime          20359.588
stime          790.896
nvcsw          164736 (8.70%)
nivcsw         1728075 (91.30%)
inblock        32
onblock        9792024
retire         0.312
ms_uops                0.008
speculation    0.085
branch_misses          90.41%
machine_clears         9.59%
frontend       0.413
idq_uops_delivered_0   0.135
icache_stall               0.089
itlb_misses                0.037
idq_uops_delivered_1   0.183
idq_uops_delivered_2   0.231
idq_uops_delivered_3   0.277
dsb_ops                    35.53%
backend        0.189
resource_stalls.sb     0.026
stalls_ldm_pending     0.399
l2_refs                    0.036
l2_misses                  0.016
l2_miss_ratio              44.20%
l3_refs                    0.014
l3_misses                  0.002
l3_miss_ratio              13.50%
A few things stand out from the topdown metrics. First the L2/L3 miss rates are relatively high but the backend stalls still don’t dominate. I expect some of this is because memory fetches happen in the “shadow” of frontend stalls. The frontend stalls for icache and itlb are high and bandwidth/packing is also part of the equation. The uop cache contributes 35% of the uops.
Overall, this benchmark is interesting in comparison to other “build” benchmarks because of a high On_CPU percentage suggesting scaling and fewer small quick processes. Otherwise it also shares attributes with these others such as having a higher percentage of frontend stalls.