
Botan is a cross-platform open-source C++ crypto library that supports most all publicly known cryptographic algorithms.
This benchmark has five workloads
- KASUMI
- AES-256
- Twofish
- Blowfish
- CAST-256
that are run in order. The benchmark is single-threaded and all testing was run pinned to core 1.
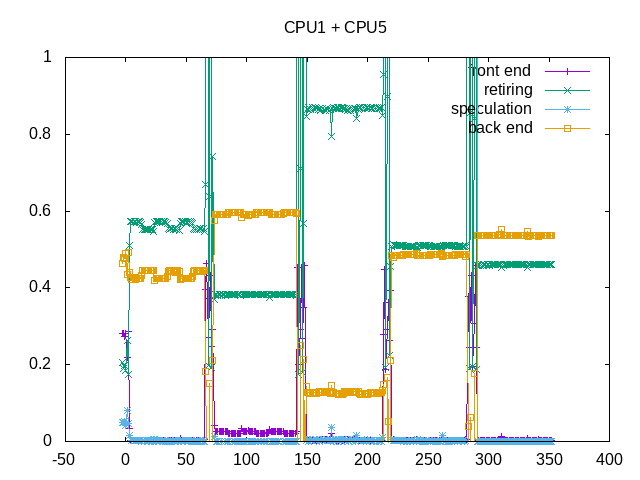
Metrics (Intel) - phoronix/botansh - pid 29716 // KASUMI On_CPU 0.125 On_Core 1.000 IPC 2.205 Retire 0.448 (44.8%) FrontEnd 0.005 (0.5%) Spec 0.113 (11.3%) Backend 0.434 (43.4%) Elapsed 20.06 Procs 3 Maxrss 10K Minflt 545 Majflt 0 Inblock 0 Oublock 16 Msgsnd 0 Msgrcv 0 Nsignals 0 Nvcsw 18 (47.4%) Nivcsw 20 Utime 20.053035 Stime 0.000000 Start 59331.01 Finish 59351.07 sh - pid 29730 // AES-256 On_CPU 0.125 On_Core 1.000 IPC 1.257 Retire 0.301 (30.1%) FrontEnd 0.025 (2.5%) Spec 0.076 (7.6%) Backend 0.598 (59.8%) Elapsed 21.91 Procs 3 Maxrss 10K Minflt 542 Majflt 0 Inblock 0 Oublock 16 Msgsnd 0 Msgrcv 0 Nsignals 0 Nvcsw 18 (51.4%) Nivcsw 17 Utime 21.907574 Stime 0.000000 Start 59401.32 Finish 59423.23 sh - pid 29744 // Twofish On_CPU 0.125 On_Core 1.000 IPC 3.125 Retire 0.659 (65.9%) FrontEnd 0.035 (3.5%) Spec 0.167 (16.7%) Backend 0.140 (14.0%) Elapsed 20.19 Procs 3 Maxrss 10K Minflt 544 Majflt 0 Inblock 0 Oublock 16 Msgsnd 0 Msgrcv 0 Nsignals 0 Nvcsw 18 (54.5%) Nivcsw 15 Utime 20.182952 Stime 0.004174 Start 59477.23 Finish 59497.42 sh - pid 29755 // Blowfish On_CPU 0.125 On_Core 0.999 IPC 2.015 Retire 0.404 (40.4%) FrontEnd 0.008 (0.8%) Spec 0.102 (10.2%) Backend 0.486 (48.6%) Elapsed 20.16 Procs 3 Maxrss 10K Minflt 540 Majflt 0 Inblock 0 Oublock 16 Msgsnd 0 Msgrcv 0 Nsignals 0 Nvcsw 18 (54.5%) Nivcsw 15 Utime 20.141498 Stime 0.007999 Start 59547.93 Finish 59568.09 sh - pid 29798 // CAST-256 On_CPU 0.125 On_Core 1.000 IPC 1.556 Retire 0.349 (34.9%) FrontEnd 0.037 (3.7%) Spec 0.087 (8.7%) Backend 0.526 (52.6%) Elapsed 20.09 Procs 3 Maxrss 10K Minflt 538 Majflt 0 Inblock 0 Oublock 16 Msgsnd 0 Msgrcv 0 Nsignals 0 Nvcsw 18 (56.2%) Nivcsw 14 Utime 20.074834 Stime 0.009996 Start 59618.48 Finish 59638.57
Overall, all the workloads spend 100% of the time on a single core. The IPC and corresponding metrics vary:
- Kasumi – IPC of 2.21 with largest issue backend stalls
- AES 256 – IPC of 1.26 with an even higher amount of backend stalls
- Twofish – IPC of 3.13 with some speculative misses but many instructions retiring
- Blowfish – IPC of 2.02 with largest issue backend stalls
- Cast 256 – IPC of 1.56 with largest issue backend stalls
sh - pid 16525 // KASUMI
	On_CPU   0.062
	On_Core  1.000
	IPC      2.377
	FrontCyc 0.003	(0.3%)
	BackCyc  0.016	(1.6%)
	Elapsed  20.06
	Procs    3
	Maxrss   10K
	Minflt   546
	Majflt   0
	Inblock  0
	Oublock  24
	Msgsnd   0
	Msgrcv   0
	Nsignals 0
	Nvcsw    18	(0.9%)
	Nivcsw   1982
	Utime    20.056265
	Stime    0.000000
	Start    70341.79
	Finish   70361.85
sh - pid 16536 // AES-256
	On_CPU   0.062
	On_Core  0.999
	IPC      1.867
	FrontCyc 0.045	(4.5%)
	BackCyc  0.071	(7.1%)
	Elapsed  23.63
	Procs    3
	Maxrss   10K
	Minflt   544
	Majflt   0
	Inblock  0
	Oublock  24
	Msgsnd   0
	Msgrcv   0
	Nsignals 0
	Nvcsw    18	(0.8%)
	Nivcsw   2261
	Utime    23.614767
	Stime    0.000000
	Start    70412.16
	Finish   70435.79
sh - pid 16547 // Twofish
	On_CPU   0.063
	On_Core  1.000
	IPC      3.500
	FrontCyc 0.074	(7.4%)
	BackCyc  0.029	(2.9%)
	Elapsed  20.23
	Procs    3
	Maxrss   10K
	Minflt   547
	Majflt   0
	Inblock  0
	Oublock  24
	Msgsnd   0
	Msgrcv   0
	Nsignals 0
	Nvcsw    18	(0.9%)
	Nivcsw   1931
	Utime    20.229029
	Stime    0.001304
	Start    70493.19
	Finish   70513.42
sh - pid 16559 // Blowfish
	On_CPU   0.062
	On_Core  1.000
	IPC      2.215
	FrontCyc 0.204	(20.4%)
	BackCyc  0.042	(4.2%)
	Elapsed  20.18
	Procs    3
	Maxrss   10K
	Minflt   540
	Majflt   0
	Inblock  0
	Oublock  24
	Msgsnd   0
	Msgrcv   0
	Nsignals 0
	Nvcsw    18	(0.9%)
	Nivcsw   1977
	Utime    20.168304
	Stime    0.003998
	Start    70564.05
	Finish   70584.23
sh - pid 16571 // CAST-256
	On_CPU   0.062
	On_Core  1.000
	IPC      1.868
	FrontCyc 0.008	(0.8%)
	BackCyc  0.004	(0.4%)
	Elapsed  20.10
	Procs    3
	Maxrss   10K
	Minflt   540
	Majflt   0
	Inblock  0
	Oublock  24
	Msgsnd   0
	Msgrcv   0
	Nsignals 0
	Nvcsw    18	(0.9%)
	Nivcsw   1901
	Utime    20.088525
	Stime    0.007997
	Start    70634.73
	Finish   70654.83
Overall, the IPC on my AMD platform is slightly higher for each of the workloads.
Process Tree - phoronix/botan
Process Tree
The process tree is simple for all workloads
    29716) sh elapsed=20.06 start=2.66 finish=22.72
      29717) botan elapsed=20.06 start=2.66 finish=22.72
        29718) botan elapsed=20.06 start=2.66 finish=22.72

Shows a single core occupied ~100% of the time. For some reason I believe the Twofish ran six times instead of three but otherwise very uniform.

IPC varies by workload but is consistent for each workload.
Overall the largest limiter is backend stalls.
This phoronix article notes improvements between Ubuntu 16.04 and 18.04, suspect GCC compiler improvements.
Next steps: Dig deeper into backend stall issues. Understand why AMD IPC is slightly higher.