
Rodinia is a suite focused upon accelerating compute-intensive applications with accelerators. CUDA, OpenMP, and OpenCL parallel models are supported by the included applications. This profile utilizes the OpenCL and OpenMP test binaries at the moment.
As described in the iiswc paper Rodinia was designed to compare implementations of classic algorithms between GPU and CPU. Below I don’t have that comparison, but instead characterize the OpenMP implementations of Rodinia in the Phoronix test suite as they might be used to compare processors.
The Phoronix test suite has four OpenMP workloads but one of them does (leukocyte) does not compile correctly out of the box. I expect Phoronix to eventually fix this, so haven’t further diagnosed to make a local fix. The remaining three benchmarks and their runtimes on my systems are:
               Intel            AMD
LavaMD         215.00           95.57
CFD Solver      65.53           32.67
Streamcluster   33.16           25.00
In the plots below they are run in this order and each has different characteristics.
Metrics (Intel) - phoronix/rodiniash - pid 10911 // LavaMD On_CPU 0.980 On_Core 7.841 IPC 1.459 Retire 0.723 (72.3%) FrontEnd 0.150 (15.0%) Spec 0.006 (0.6%) Backend 0.121 (12.1%) Elapsed 215.65 Procs 10 Minflt 212459 Majflt 0 Utime 1690.77 (100.0%) Stime 0.21 (0.0%) Start 415189.98 Finish 415405.63 sh - pid 11000 // CFD Solver On_CPU 0.974 On_Core 7.790 IPC 0.641 Retire 0.323 (32.3%) FrontEnd 0.093 (9.3%) Spec 0.003 (0.3%) Backend 0.580 (58.0%) Elapsed 72.33 Procs 10 Minflt 14414 Majflt 0 Utime 562.78 (99.9%) Stime 0.69 (0.1%) Start 415855.61 Finish 415927.94 sh - pid 11064 // Streamcluster On_CPU 0.973 On_Core 7.782 IPC 0.909 Retire 0.459 (45.9%) FrontEnd 0.097 (9.7%) Spec 0.007 (0.7%) Backend 0.437 (43.7%) Elapsed 33.28 Procs 10 Minflt 33772 Majflt 0 Utime 258.93 (100.0%) Stime 0.04 (0.0%) Start 416291.28 Finish 416324.56
Metrics show similarities where all benchmarks run almost 100% on the CPU and all have a basic structure of one parent process delegating work to children on all the cores. The differences are that CFD solver and to lesser extent Streamcluster are more backend bound than LavaMD and thus also have higher IPC.
Metrics (AMD) - phoronix/rodiniash - pid 12067 // LavaMD On_CPU 0.973 On_Core 15.565 IPC 1.835 FrontCyc 0.016 (1.6%) BackCyc 0.175 (17.5%) Elapsed 95.55 Procs 18 Minflt 212510 Majflt 0 Utime 1487.08 (100.0%) Stime 0.17 (0.0%) Start 66011.18 Finish 66106.73 sh - pid 12166 // CFD Solver On_CPU 0.929 On_Core 14.869 IPC 0.824 FrontCyc 0.001 (0.1%) BackCyc 0.034 (3.4%) Elapsed 32.78 Procs 18 Minflt 14435 Majflt 0 Utime 486.68 (99.9%) Stime 0.72 (0.1%) Start 66317.66 Finish 66350.44 sh - pid 12224 // Streamcluster On_CPU 0.955 On_Core 15.283 IPC 0.708 FrontCyc 0.001 (0.1%) BackCyc 0.107 (10.7%) Elapsed 25.05 Procs 18 Minflt 33801 Majflt 0 Utime 382.81 (100.0%) Stime 0.02 (0.0%) Start 66425.54 Finish 66450.59
IPCs for LavaMD and CFD Solver are higher for AMD than Intel while Streamcluster is lower.
Process Tree - phoronix/rodinia
Process Tree
The process trees for three benchmarks are similar and simple
    10911) sh elapsed=215.65 start=0.00 finish=215.65
      10912) rodinia elapsed=215.65 start=0.00 finish=215.65
        10913) lavaMD elapsed=215.65 start=0.00 finish=215.65
        10914) lavaMD elapsed=215.01 start=0.64 finish=215.65
        10915) lavaMD elapsed=215.01 start=0.64 finish=215.65
        10916) lavaMD elapsed=215.01 start=0.64 finish=215.65
        10917) lavaMD elapsed=215.01 start=0.64 finish=215.65
        10918) lavaMD elapsed=215.01 start=0.64 finish=215.65
        10919) lavaMD elapsed=215.01 start=0.64 finish=215.65
        10920) lavaMD elapsed=215.01 start=0.64 finish=215.65

    11000) sh elapsed=72.33 start=0.00 finish=72.33
      11001) rodinia elapsed=72.33 start=0.00 finish=72.33
        11002) euler3d_cpu_dou elapsed=72.32 start=0.01 finish=72.33
        11003) euler3d_cpu_dou elapsed=71.16 start=1.17 finish=72.33
        11004) euler3d_cpu_dou elapsed=71.16 start=1.17 finish=72.33
        11005) euler3d_cpu_dou elapsed=71.16 start=1.17 finish=72.33
        11006) euler3d_cpu_dou elapsed=71.16 start=1.17 finish=72.33
        11007) euler3d_cpu_dou elapsed=71.16 start=1.17 finish=72.33
        11008) euler3d_cpu_dou elapsed=71.16 start=1.17 finish=72.33
        11009) euler3d_cpu_dou elapsed=71.16 start=1.17 finish=72.33

    11064) sh elapsed=33.28 start=0.00 finish=33.28
      11065) rodinia elapsed=33.27 start=0.01 finish=33.28
        11066) sc_omp elapsed=33.26 start=0.01 finish=33.27
        11067) sc_omp elapsed=32.30 start=0.97 finish=33.27
        11068) sc_omp elapsed=32.30 start=0.97 finish=33.27
        11069) sc_omp elapsed=32.30 start=0.97 finish=33.27
        11070) sc_omp elapsed=32.30 start=0.97 finish=33.27
        11071) sc_omp elapsed=32.30 start=0.97 finish=33.27
        11072) sc_omp elapsed=32.30 start=0.97 finish=33.27
        11073) sc_omp elapsed=32.30 start=0.97 finish=33.27
 About this graph
Almost all CPUs are busy all the time. As an aside, the Phoronix test suite runs each benchmark three times. If the variation is too large, it may run one more more times. This is why in this instance one sees the first workload four times and in other graphs only three times.
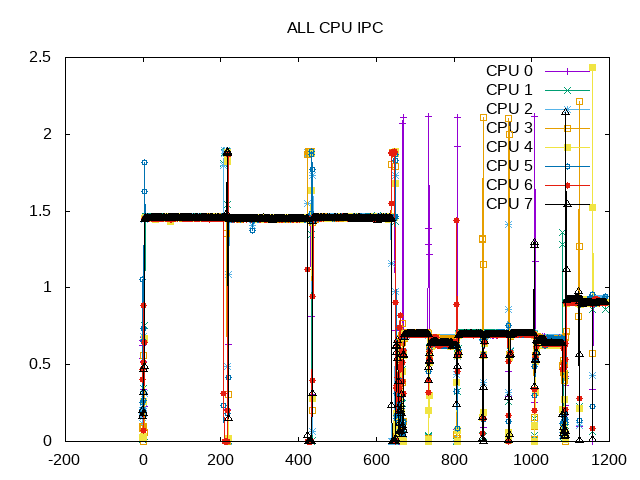
IPC of LavaMD is highest. CFD Solver ran six times with a low IPC and Streamcluster slightly higher.
 About this graph
LavaMD has relatively high retire rate and lower front-end and back-end stalls. CFD solver has a high amount of backend stalls that is useful to investigate further (memory/cache or core)?. Streamcluster also has a higher amount of backend stalls.
 About this graph
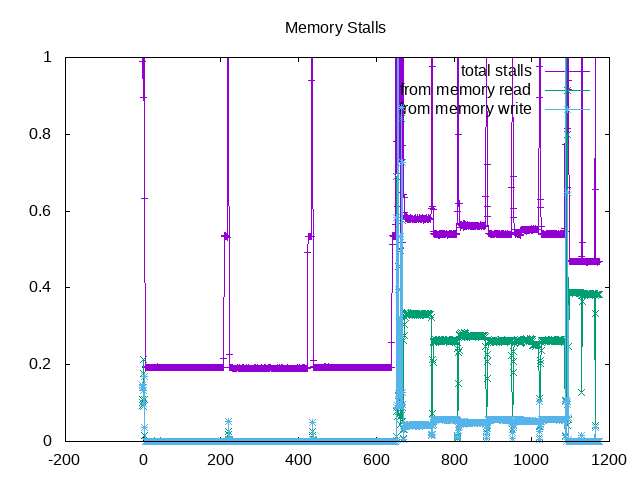
The next level of topdown analysis shows that backend stalls in CFD solver are more split between memory and other, while the stall issue for Streamcluster is predominantly memory.
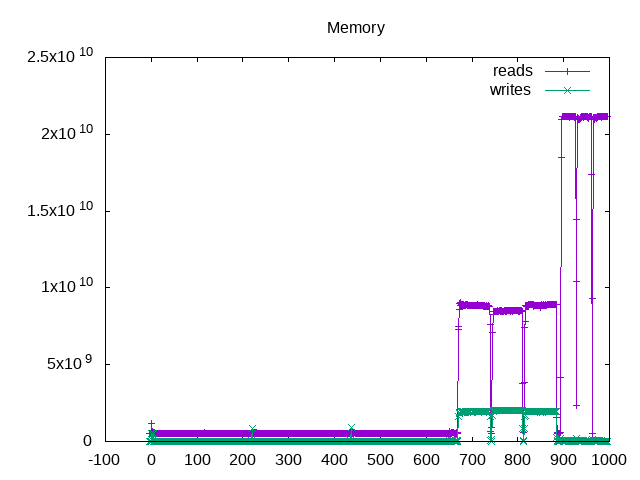
Also decided to print the amount of memory traffic. As expected LavaMD has relatively little traffic. CFD Solver has lowest IPC but medium amount of memory traffic and Streamcluster has the highest external memory traffic.
As an interesting aside, the phoronix article compares Ryzen 2700x and Ryzen 1700 on both with following ratios
              LavaMD   CFD Solver
Ryzen 2700x    88.16     26.65
Ryzen 1700    102.19     30.31
Ratio          +15%       +13%
Two larger differences between these processors are increased frequencies (3.0 base/3.7 boost to 3.7 base/4.3 boost) and decreased cache latencies. I would expect the cache to primarily help the backend-bound CFD solver and the increased frequency to perhaps help the LavaMD that doesn’t have to wait on memory as much. More difficult to tease these two apart without having systems.
Next Steps: Why the Intel AMD IPC differences for LavaMD? Further dig into backend stall issues for CFD Solver.