
This is a benchmark of Hackbench, a test of the Linux kernel scheduler.
Hackbench is also described as an Ubuntu man page
Hackbench is both a benchmark and a stress test for the Linux kernel
scheduler. It’s main job is to create a specified number of pairs of
schedulable entities (either threads or traditional processes) which
communicate via either sockets or pipes and time how long it takes for
each pair to send data back and forth.
Phoronix allows configuration of the test with a count of tasks (1,2,4,8,16 or 32) and choice of threads or processes. In the examples below, I ran everything with a count of 8 processes to match this phoronix article.
A general comment before the summary below: I’m not sure a more traditional performance counter analysis makes as much sense in comparing this workload since it is primarily a system-level benchmark and much more a measurement of the algorithms used in kernel scheduling and IPC communication. However, included below since easily collected for other benchmarks as well.
Process Tree - phoronix/hackbench
Process Tree
The overall process tree is simple, a master process spawning many children and then letting these interact. Something in this communication seems to confuse my ptrace(2) based process tree mapping and I get “orphan” processes that aren’t connected. However, my ftrace-based process tree builder doesn’t suffer from the same issue and is reported here.
sh - pid 23996
	On_CPU   0.959
	On_Core  7.676
	IPC      0.591
	Retire   0.396	(39.6%)
	FrontEnd 0.309	(30.9%)
	Spec     0.057	(5.7%)
	Backend  0.238	(23.8%)
	Elapsed  48.13
	Procs    168
	Maxrss   10K
	Minflt   9447
	Majflt   0
	Inblock  0
	Oublock  24
	Msgsnd   0
	Msgrcv   0
	Nsignals 0
	Nvcsw    6213715	(85.2%)
	Nivcsw   1078232
	Utime    39.212830
	Stime    330.232647
	Start    238903.58
	Finish   238951.71
Overall IPC of 0.59 with both frontend and backend stalls. Interestingly no reports of msgsnd/msgrcv from the rusage(2) information, so not sure this gets plumbed through from the kernel. Given the “orphan” issue, the amount of processes might be higher than 168.
Metrics (AMD) - phoronix/hackbenchsh - pid 21490 On_CPU 0.950 On_Core 15.194 IPC 0.724 FrontCyc 0.100 (10.0%) BackCyc 0.081 (8.1%) Elapsed 21.12 Procs 253 Maxrss 10K Minflt 9462 Majflt 0 Inblock 0 Oublock 16 Msgsnd 0 Msgrcv 0 Nsignals 0 Nvcsw 3652727 (86.5%) Nivcsw 569286 Utime 22.210276 Stime 298.689977 Start 248622.59 Finish 248643.71
AMD metrics look similar with just slightly higher IPC.
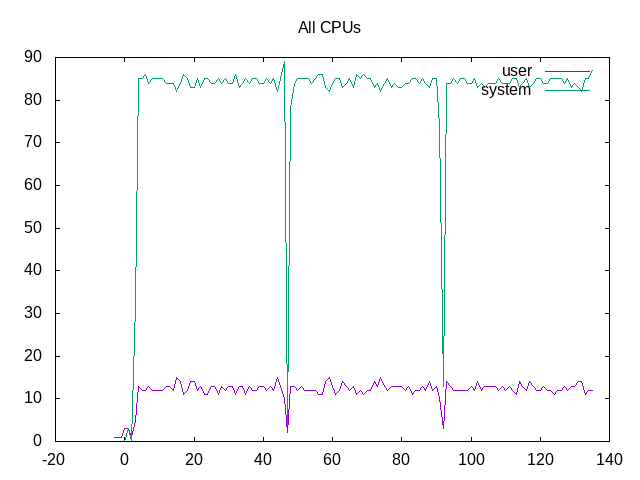
As expected adding the time across all cores, this is very much a system-level benchmark.
 About this graph
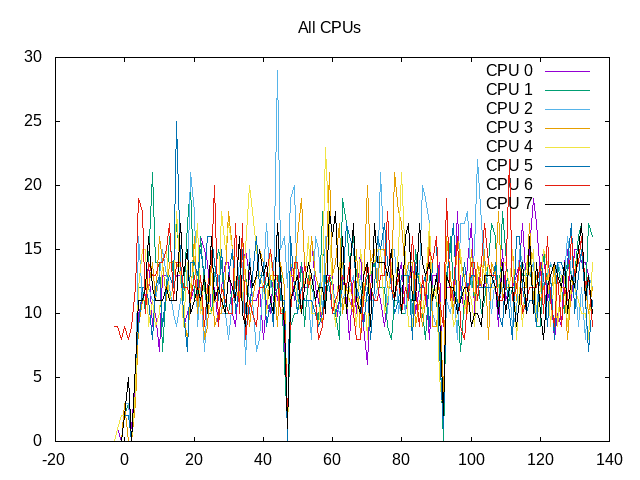
Breaking out the cores individually shows some chaos in being scheduled, as expected.
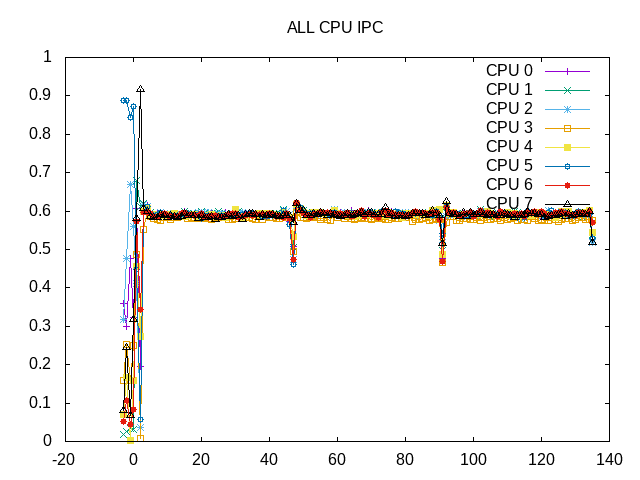
IPC is fairly consistent.
 About this graph
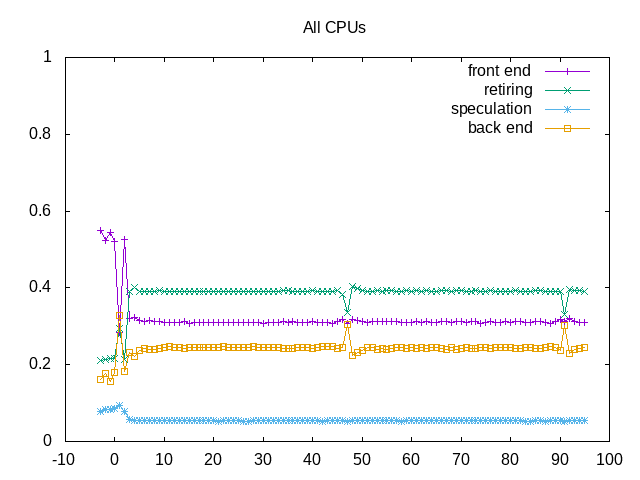
Shows both level of frontend and backend stalls limiting the retirement rate.
Next steps: Try hackbench with some different configurations, e.g. with processes instead of threads.