
This test runs the Java version of SciMark 2.0, which is a benchmark for scientific and numerical computing developed by programmers at the National Institute of Standards and Technology. This benchmark is made up of Fast Foruier Transform, Jacobi Successive Over-relaxation, Monte Carlo, Sparse Matrix Multiply, and dense LU matrix factorization benchmarks.
scimark2 and java-scimark2 were developed around 1999 by NIST: NIST java SciMark 2.0 page. They are single-threaded and designed in a time when caches were smaller. All tests below were run pinned to core 1.
java-scimark2 is single-threaded and designed in a time when caches were smaller, though is run with the -large option for larger data sets. All tests below were run pinned to core 1. The test runs all five workloads below in a single process and reports both individual scores and a composite. As you’ll see in the graphs, these workloads have somewhat different characteristics and can be spotted separately on the graphs and overall metrics like IPC will also be a composite. The overall runtime is shorter than the C version and also appears from data that a smaller memory model is used.
- FFT
- SOR
- MonteCarlo
- Sparse matmul
- LU
described in more detail here.
Metrics (Intel) - phoronix/java-scimark2sh - pid 5679 On_CPU 0.125 On_Core 0.998 IPC 2.770 Retire 0.499 (49.9%) FrontEnd 0.040 (4.0%) Spec 0.160 (16.0%) Backend 0.301 (30.1%) Elapsed 24.97 Procs 12 Minflt 3518 Majflt 0 Utime 24.92 (100.0%) Stime 0.01 (0.0%) Start 5675.37 Finish 5700.34
Metrics above were adjusted to account for the process being single-threaded, i.e. twice as many slots available and my tool only assumed these across two processes. The front-end time is very small, so fits in iCache and TLB. Speculation somewhat high and backend also higher, these will break out from some of the workloads below.
Metrics (AMD) - phoronix/java-scimark2sh - pid 28778 On_CPU 0.062 On_Core 0.999 IPC 3.666 FrontCyc 0.046 (4.6%) BackCyc 0.530 (53.0%) Elapsed 27.99 Procs 12 Minflt 3422 Majflt 0 Utime 27.94 (100.0%) Stime 0.01 (0.0%) Start 312069.64 Finish 312097.63
The IPC measurement seems high, perhaps sanity check here.
Process Tree - phoronix/java-scimark2Process Tree
   5679) sh elapsed=24.97 start=2.56 finish=27.53
      5680) java-scimark2 elapsed=24.97 start=2.56 finish=27.53
        5681) java elapsed=24.97 start=2.56 finish=27.53
        5682) java elapsed=24.96 start=2.57 finish=27.53
        5683) java elapsed=24.96 start=2.57 finish=27.53
        5684) java elapsed=24.95 start=2.58 finish=27.53
        5685) java elapsed=24.95 start=2.58 finish=27.53
        5686) java elapsed=24.94 start=2.59 finish=27.53
        5687) java elapsed=24.94 start=2.59 finish=27.53
        5688) java elapsed=24.94 start=2.59 finish=27.53
        5689) java elapsed=24.94 start=2.59 finish=27.53
        5690) java elapsed=24.94 start=2.59 finish=27.53
Multiple java threads are spawned, though since the workload itself was single-threaded, I kept these pinned to a single core.
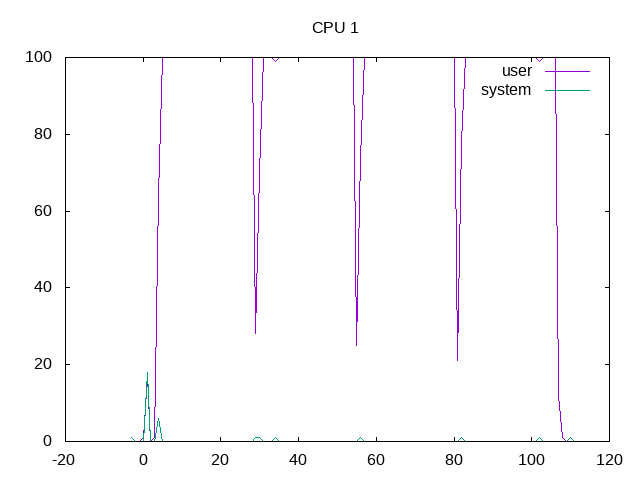
Processor core 1 is kept scheduled almost 100% of the time.
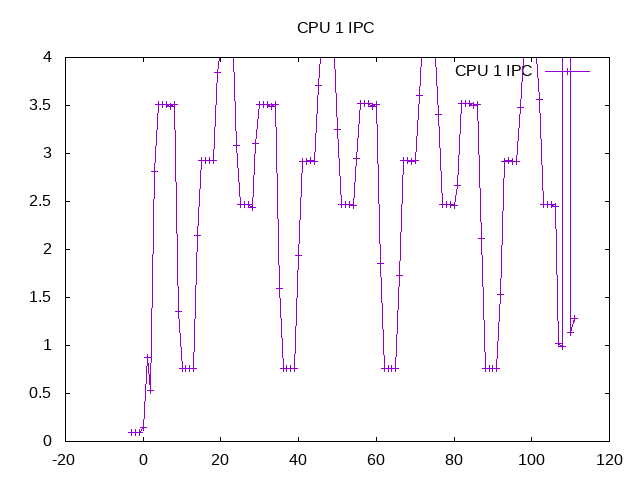
IPCs for the five workloads can be seen with FFT (3.5), SOR (0.8), MonteCarlo (~3), Sparse Matmul (~4) and LU (~2.5) creating the composite IPC of 2.77. These are all higher than the C version of scimark2 which uses the -large model, so expect the models are not the same.
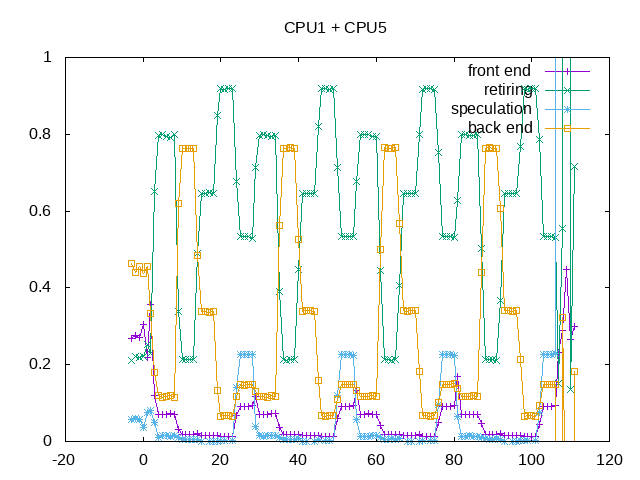
The topdown metrics also show variations between the five workloads where the “retiring” are a little lower than I would expect for the IPC:
- FFT – retires over 80% of slots and is much less backend bound than the C version
- SOR – has a backend issue
- MonteCarlo – is retiring 65%
- SparseMatmul – is highest retirement rate overall
- LU – has higher speculation misses
Overall a next level of analysis could tease these apart to characterize them separately.
Next steps: Separate out workloads. Investigate IPC that seem higher as compared to the retirement rate. Look at speculative misses.