
Metrics (Intel) - phoronix/ffmpegThis test uses FFmpeg for testing the system’s audio/video encoding performance.
	On_CPU   0.678
	On_Core  5.428
	IPC      1.271
	Retire   0.265	(26.5%)
	FrontEnd 0.102	(10.2%)
	Spec     0.153	(15.3%)
	Backend  0.481	(48.1%)
	Elapsed   7.20
	Procs    34
	Maxrss   152K
	Minflt   41862
	Majflt   0
	Inblock  0
	Oublock  8
	Msgsnd   0
	Msgrcv   0
	Nsignals 0
	Nvcsw    20501	(97.5%)
	Nivcsw   515
	Utime    38.723219
	Stime    0.356720
	Start    688861.48
	Finish   688868.68
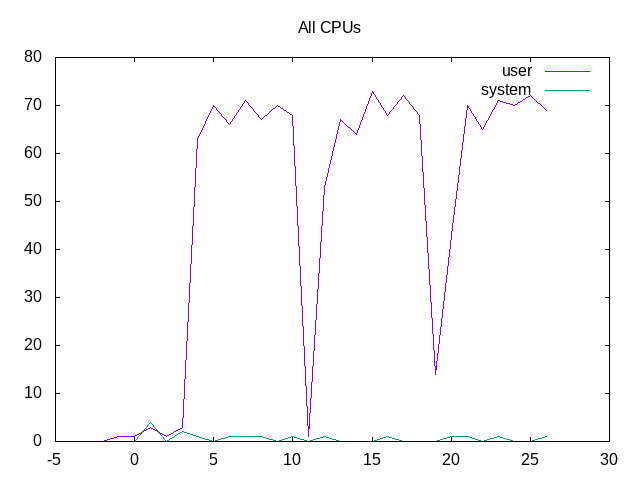
Overall, On_CPU of only 68% with many voluntary context switches, so latency timing of the processes matters. The IPC is moderately high and backend stalls are the primary limiter. Overall duration of 7.2 seconds is short.
Metrics (AMD) - phoronix/ffmpegsh - pid 1228 On_CPU 0.276 On_Core 4.408 IPC 1.637 FrontCyc 0.000 (0.0%) BackCyc 0.000 (0.0%) Elapsed 9.51 Procs 65 Maxrss 227K Minflt 62022 Majflt 0 Inblock 0 Oublock 8 Msgsnd 0 Msgrcv 0 Nsignals 0 Nvcsw 34648 (90.7%) Nivcsw 3544 Utime 41.518247 Stime 0.403098 Start 572298.45 Finish 572307.96
IPC on AMD is a fair amount higher than Intel, although the elapsed duration is longer. the On_CPU is also less than half that of Intel. Twice as many threads run, the core is used less, and the elapsed time reported is longer.
I ran this by hand, passing in a “-threads” option that is normally set to the number of cores. Following were times reported by time(1) for various thread configurations on my AMD system:
1 thread - 12.746 seconds real time
2 threads - 9.453 seconds real time
4 threads - 9.472 seconds real time
8 threads - 9.470 seconds real time
16 threads - 9.327 seconds real time
32 threads - 9.491 seconds real time
64 threads - 9.563 seconds real time
So while having 2 threads is better than 1, the particular workload selected to run ffmpeg is not able to take advantage of more threads than that and stays flat before having time go up.
Process Tree - phoronix/ffmpeg
Process Tree
There are four processes per core.
    28646) sh
      28647) ffmpeg
        28648) ffmpeg
        28649) ffmpeg
        28650) ffmpeg
        28651) ffmpeg
        28652) ffmpeg
        28653) ffmpeg
        28654) ffmpeg
        28655) ffmpeg
        28656) ffmpeg
        28657) ffmpeg
        28658) ffmpeg
        28659) ffmpeg
        28660) ffmpeg
        28661) ffmpeg
        28662) ffmpeg
        28663) ffmpeg
        28664) ffmpeg
        28665) ffmpeg
        28666) ffmpeg
        28667) ffmpeg
        28668) ffmpeg
        28669) ffmpeg
        28670) ffmpeg
        28671) ffmpeg
        28672) ffmpeg
        28673) ffmpeg
        28674) ffmpeg
        28675) ffmpeg
        28676) ffmpeg
        28677) ffmpeg
        28678) ffmpeg
        28679) ffmpeg
The total On_CPU time is ~2/3 of the total, the rest marked as idle.
 About this graph
Individual cores are scheduled out.

Individual IPC have some noise mostly with quick times for the benchmark.
 About this graph
Backend stalls are the largest issue.
A Phoronix benchmark article shows Clearlinux with a considerable lead on this benchmark. Likely a customized version or very targeted optimizations?
Next steps: What does Clearlinux do to advantage the benchmark? Why does AMD have higher IPC and lower scores?