
This test runs the ANSI C version of SciMark 2.0, which is a benchmark for scientific and numerical computing developed by programmers at the National Institute of Standards and Technology. This test is made up of Fast Foruier Transform, Jacobi Successive Over-relaxation, Monte Carlo, Sparse Matrix Multiply, and dense LU matrix factorization benchmarks.
scimark2 and java-scimark2 were developed around 1999 by NIST: NIST java SciMark 2.0 page. There were GCC bugs related to scimark2: 54073 and 53397 and perhaps others so useful to make sure one is getting code you expect.
scimark is single-threaded and designed in a time when caches were smaller, though is run with the -large option for larger data sets. All tests below were run pinned to core 1. The test runs all five workloads below in a single process and reports both individual scores and a composite. As you’ll see in the graphs, these workloads have somewhat different characteristics and can be spotted separately on the graphs and overall metrics like IPC will also be a composite.
- FFT
- SOR
- MonteCarlo
- Sparse matmul
- LU
described in more detail here.
Metrics (Intel) - phoronix/scimark2sh - pid 3669 On_CPU 0.125 On_Core 1.000 IPC 1.950 Retire 0.392 (39.2%) FrontEnd 0.025 (2.5%) Spec 0.150 (15.0%) Backend 0.433 (43.3%) Elapsed 26.66 Procs 3 Minflt 8261 Majflt 0 Utime 26.65 (100.0%) Stime 0.00 (0.0%) Start 3794.14 Finish 3820.80
Metrics above were adjusted to account for the process being single-threaded, i.e. twice as many slots available and my tool only assumed these across two processes. The front-end time is very small, so fits in iCache and TLB. Speculation somewhat high and backend also higher, these will break out from some of the workloads below.
Metrics (AMD) - phoronix/scimark2sh - pid 28072 On_CPU 0.062 On_Core 0.999 IPC 1.704 FrontCyc 0.977 (97.7%) BackCyc 0.062 (6.2%) Elapsed 26.37 Procs 3 Minflt 8263 Majflt 0 Utime 26.35 (100.0%) Stime 0.00 (0.0%) Start 310324.42 Finish 310350.79
AMD metrics slow slightly lower IPC.
Process Tree - phoronix/scimark2
Process Tree
The process tree is simple
   3669) sh elapsed=26.66 start=0.00 finish=26.66
      3670) scimark2 elapsed=26.66 start=0.00 finish=26.66
        3671) scimark2 elapsed=26.66 start=0.00 finish=26.66
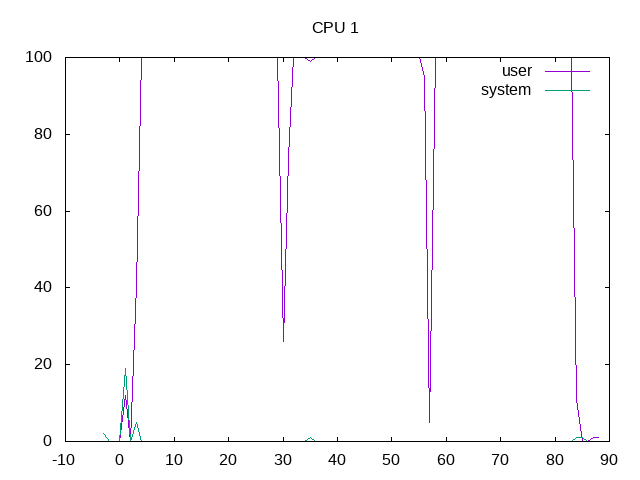
Processor core 1 is kept scheduled almost 100% of the time.
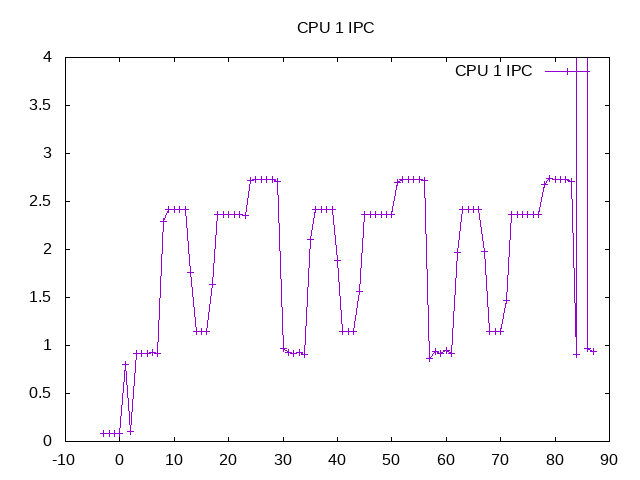
IPCs for the five workloads can be seen with FFT (~1), SOR (~2.5), MonteCarlo (~1), Sparse Matmul (~2.5) and LU (~2.7) creating the composite IPC of 1.98.
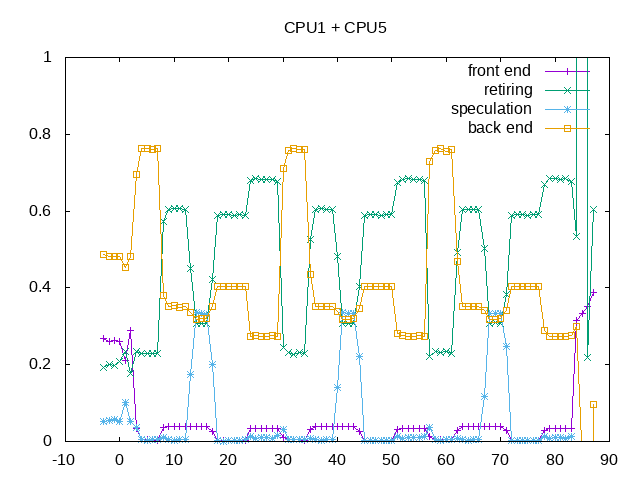
The topdown metrics also show variations between the five workloads:
- FFT – is backend bound
- SOR – has a smaller backend issue and retires more slots
- MonteCarlo – has a particularly high amount of speculation misses
- SparseMatmul – is similar to SOR with slightly higher back end and lower front end stalls
- LU – has highest retire rates
Overall a next level of analysis could tease these apart to characterize them separately.
Next steps: Understand AMD/Intel IPC gap, speculation misses in Monte Carlo, backend misses in SOR by separating out the workloads.