
This page is a home for analysis of the parboil benchmark as part of the Phoronix test suite. Description of this suite is:
The Parboil Benchmarks from the IMPACT Research Group at University of Illinois are a set of throughput computing applications for looking at computing architecture and compilers. Parboil test-cases support OpenMP, OpenCL, and CUDA multi-processing environments. However, at this time the test profile is just making use of the OpenMP and OpenCL test workloads.
The link to the IMPACT research group for these benchmarks is here.
This test has 10 workloads:
Parboil 2.5:
pts/parboil-1.1.2
Processor Test Configuration
1: OpenMP CUTCP
2: OpenMP MRI-Q
3: OpenMP MRI Gridding
4: OpenMP Stencil
5: OpenMP LBM
6: OpenCL BFS
7: OpenCL TPACF
8: OpenCL LBM
9: OpenCL MRI Gridding
10: OpenCL Histo
11: Test All Options
Test:
I don’t have OpenCL on my test system and hence these benchmarks do not run. In addition, the MRI-Q benchmark executable is missing references to ComputeQCPU either because the file didn’t compile or link properly (not yet further diagnosed). The remaining four tests build and run correctly.
The remaining parboil benchmarks have the following descriptions
LBM – A fluid dynamics simulation of an enclosed, lid-driven cavity, using the Lattice-Boltzmann Method.
CUTCP – Computes the short-range component of Coulombic potential at each grid point over a 3D grid containing point charges representing an explicit-water biomolecular model.
Stencil – An iterative Jacobi stencil operation on a regular 3-D grid.
These benchmarks are run in the following order: LBM, CUTCP, Stencil. All are OpenMP programs running one thread per core.
Metrics (Intel) - phoronix/parboilsh - pid 31043 On_CPU 0.958 On_Core 7.665 IPC 1.152 Retire 0.493 (49.3%) FrontEnd 0.229 (22.9%) Spec 0.128 (12.8%) Backend 0.150 (15.0%) Elapsed 209.30 Procs 14 Maxrss 1211K Minflt 418088 Majflt 0 Inblock 0 Oublock 50648 Msgsnd 0 Msgrcv 0 Nsignals 0 Nvcsw 20190 (76.8%) Nivcsw 6102 Utime 1603.134343 Stime 1.079020 Start 131779.24 Finish 131988.54
LBM runs the longest at 209 seconds (and tends to dominate the graphs visually). It is On_CPU at 96% and has more frontend stalls than backend stalls. It also has a moderate level of bad speculation. At ~75% of the total, voluntary context switches are jumping between threads.
sh - pid 31096
	On_CPU   0.919
	On_Core  7.353
	IPC      0.842
	Retire   0.432	(43.2%)
	FrontEnd 0.142	(14.2%)
	Spec     0.144	(14.4%)
	Backend  0.282	(28.2%)
	Elapsed  14.73
	Procs    14
	Maxrss   35K
	Minflt   24364
	Majflt   0
	Inblock  0
	Oublock  656
	Msgsnd   0
	Msgrcv   0
	Nsignals 0
	Nvcsw    97	(15.4%)
	Nivcsw   531
	Utime    108.265967
	Stime    0.047483
	Start    132411.73
	Finish   132426.46
LBM runs less than 10% of the time of CUTCP. The IPC is somewhat lower at 0.84 and backend stalls are higher at over 25%.
sh - pid 31140
	On_CPU   0.908
	On_Core  7.267
	IPC      0.280
	Retire   0.117	(11.7%)
	FrontEnd 0.054	(5.4%)
	Spec     0.046	(4.6%)
	Backend  0.783	(78.3%)
	Elapsed  33.43
	Procs    14
	Maxrss   265K
	Minflt   103024
	Majflt   0
	Inblock  0
	Oublock  131096
	Msgsnd   0
	Msgrcv   0
	Nsignals 0
	Nvcsw    721	(43.0%)
	Nivcsw   955
	Utime    242.750514
	Stime    0.185575
	Start    132465.53
	Finish   132498.96
Stencil has slightly longer runtime. It has the lowest IPC and a large number of backend stalls.
Metrics (AMD) - phoronix/parboilsh - pid 31937 // LBM On_CPU 0.970 On_Core 15.514 IPC 0.905 FrontCyc 0.000 (0.0%) BackCyc 0.000 (0.0%) Elapsed 145.64 Procs 22 Maxrss 1211K Minflt 418097 Majflt 0 Inblock 8 Oublock 50648 Msgsnd 0 Msgrcv 0 Nsignals 0 Nvcsw 30062 (12.1%) Nivcsw 219315 Utime 2258.300102 Stime 1.089136 Start 696877.29 Finish 697022.93 sh - pid 32042 // CUTCP On_CPU 0.890 On_Core 14.240 IPC 1.068 FrontCyc 0.000 (0.0%) BackCyc 0.000 (0.0%) Elapsed 6.55 Procs 22 Maxrss 35K Minflt 24428 Majflt 0 Inblock 0 Oublock 656 Msgsnd 0 Msgrcv 0 Nsignals 0 Nvcsw 174 (1.9%) Nivcsw 9049 Utime 93.116885 Stime 0.156270 Start 697324.42 Finish 697330.97 sh - pid 32111 // Stencil On_CPU 0.926 On_Core 14.812 IPC 0.168 FrontCyc 0.000 (0.0%) BackCyc 0.000 (0.0%) Elapsed 30.50 Procs 22 Maxrss 264K Minflt 103038 Majflt 0 Inblock 0 Oublock 131096 Msgsnd 0 Msgrcv 0 Nsignals 0 Nvcsw 1394 (3.1%) Nivcsw 43984 Utime 451.568290 Stime 0.195263 Start 697353.89 Finish 697384.39
On_CPU for AMD is roughly similar. The IPC for Stencil is considerably lower and the elapsed time almost same as Intel but using twice as many threads.
Process Tree - phoronix/parboil
Process Tree
The process trees are simple. All essentially a variation of the below.
    31140) sh
      31141) parboil
        31142) python
          31143) make
          31144) make
            31145) stencil
            31146) stencil
            31147) stencil
            31148) stencil
            31149) stencil
            31150) stencil
            31151) stencil
            31152) stencil
          31153) python
 About this graph
On_CPU is highest for LBM and this dominates the averages. It is closer to 90% for CUTCP and Stencil.
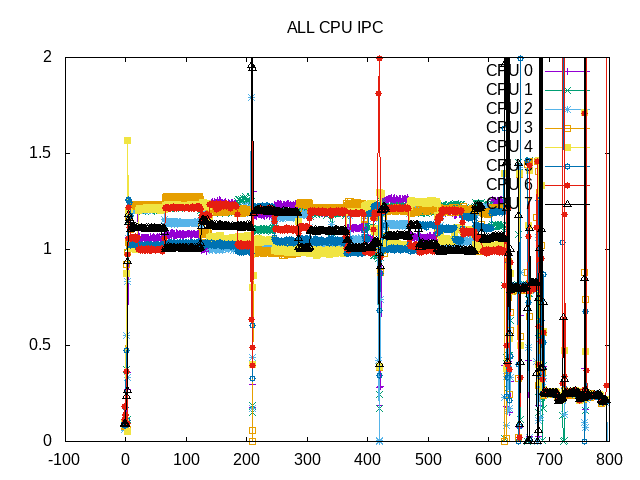
IPC is consistent across the workload. LBM has highest IPC, CUTCP is next highest and Stencil is very low.
 About this graph
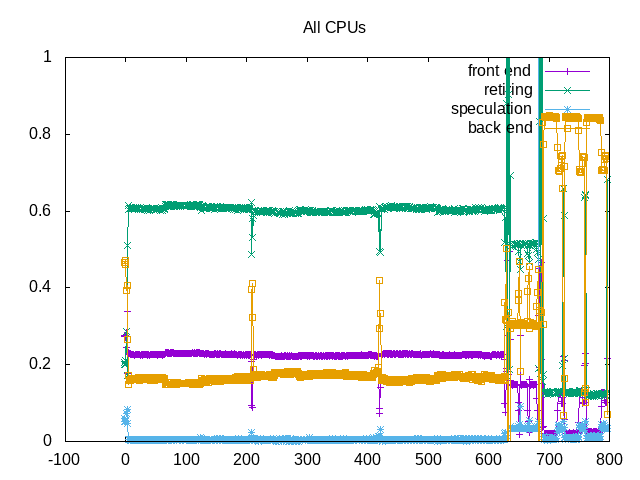
Topdown metrics show effects of backend stalls for Stencil and to lesser extent CUTCP. For LBM, frontend stalls are higher issue.
on_cpu         0.915
elapsed        892.974
utime          6530.158
stime          3.373
nvcsw          52873 (63.21%)
nivcsw         30776 (36.79%)
inblock        40
onblock        941288
retire         0.500
ms_uops                0.007
speculation    0.009
branch_misses          2.52%
machine_clears         97.48%
frontend       0.184
idq_uops_delivered_0   0.024
icache_stall               0.004
itlb_misses                0.000
idq_uops_delivered_1   0.079
idq_uops_delivered_2   0.116
idq_uops_delivered_3   0.149
dsb_ops                    37.69%
backend        0.307
resource_stalls.sb     0.032
stalls_ldm_pending     0.365
l2_refs                    0.022
l2_misses                  0.008
l2_miss_ratio              38.79%
l3_refs                    0.004
l3_misses                  0.002
l3_miss_ratio              50.26%
Overall topdown metrics are an aggregate of all three. However, a reasonable percentage of backend stalls and cache misses (particularly stencil). The frontend stalls seem to be more poor allocation than icache/itlb misses and 38% of the uops come from the cache. Bad speculation is not high, but interestingly coming from machine clears.