
This is a test of GraphicsMagick with its OpenMP implementation that performs various imaging tests to stress the system’s CPU.
The Graphics Magick code has five operations:
GraphicsMagick 1.3.28:
    pts/graphics-magick-1.7.0
    Processor Test Configuration
        1: HWB Color Space
        2: Blur
        3: Local Adaptive Thresholding
        4: Resizing
        5: Sharpen
These are run in the following order: blur, sharpen, resize, color space and adaptive thresholding. The first four run with processes on each core, the adapting thresholding has only a single copy.
Metrics (Intel) - phoronix/graphics-magickphoronix-test-s - pid 31760 On_CPU 0.300 On_Core 2.399 IPC 1.479 Retire 0.820 (82.0%) FrontEnd 0.153 (15.3%) Spec 0.136 (13.6%) Backend -0.108 (-10.8%) Elapsed 949.47 Procs 392 Maxrss 231K Minflt 40568424 Majflt 0 Inblock 0 Oublock 1072 Msgsnd 0 Msgrcv 0 Nsignals 0 Nvcsw 27022 (54.4%) Nivcsw 22623 Utime 2229.506677 Stime 47.962057 Start 583656.30 Finish 584605.77
First some observations about metrics for all the workloads together: (1) the On_CPU is only 30% and this has 50% voluntary context switches. While there isn’t a large amount of I/O, this does suggest that processes are mostly stopped and not scheduled on the cores (2) the topdown metrics assume something running on all cores and hence reason they look bogus above; more useful to look at workload by workload (3) the overall IPC above is slightly lower but consistent with other workloads. Looking at these as a single-threaded program “fixes” the topdown metrics overall:
	On_CPU   0.300
	On_Core  2.399
	IPC      1.479
	Retire   0.410	(41.0%)
	FrontEnd 0.076	(7.6%)
	Spec     0.068	(6.8%)
	Backend  0.446	(44.6%)
	Elapsed  949.47
	Procs    392
	Maxrss   231K
	Minflt   40568424
	Majflt   0
	Inblock  0
	Oublock  1072
	Msgsnd   0
	Msgrcv   0
	Nsignals 0
	Nvcsw    27022	(54.4%)
	Nivcsw   22623
	Utime    2229.506677
	Stime    47.962057
	Start    583656.30
	Finish   584605.77
Now below the separate workloads:
sh - pid 31991  // blur
	On_CPU   0.311
	On_Core  2.489
	IPC      1.511
	Retire   0.807	(80.7%)
	FrontEnd 0.169	(16.9%)
	Spec     0.139	(13.9%)
	Backend  -0.115	(-11.5%)
	Elapsed  60.26
	Procs    10
	Maxrss   123K
	Minflt   4632988
	Majflt   0
	Inblock  0
	Oublock  16
	Msgsnd   0
	Msgrcv   0
	Nsignals 0
	Nvcsw    2248	(59.0%)
	Nivcsw   1563
	Utime    145.145696
	Stime    4.828832
	Start    583659.06
	Finish   583719.32
sh - pid 32030 // sharpen
	On_CPU   0.558
	On_Core  4.464
	IPC      1.599
	Retire   0.899	(89.9%)
	FrontEnd 0.102	(10.2%)
	Spec     0.064	(6.4%)
	Backend  -0.064	(-6.4%)
	Elapsed  60.37
	Procs    10
	Maxrss   84K
	Minflt   2471114
	Majflt   0
	Inblock  0
	Oublock  16
	Msgsnd   0
	Msgrcv   0
	Nsignals 0
	Nvcsw    1256	(36.4%)
	Nivcsw   2194
	Utime    266.155163
	Stime    3.322177
	Start    583849.96
	Finish   583910.33
sh - pid 32066 // resize
	On_CPU   0.328
	On_Core  2.628
	IPC      1.479
	Retire   0.785	(78.5%)
	FrontEnd 0.121	(12.1%)
	Spec     0.162	(16.2%)
	Backend  -0.067	(-6.7%)
	Elapsed  60.28
	Procs    10
	Maxrss   218K
	Minflt   2074168
	Majflt   0
	Inblock  0
	Oublock  16
	Msgsnd   0
	Msgrcv   0
	Nsignals 0
	Nvcsw    3203	(62.6%)
	Nivcsw   1915
	Utime    155.858677
	Stime    2.551043
	Start    584041.29
	Finish   584101.57
sh - pid 32101  // HWB color space
	On_CPU   0.252
	On_Core  2.017
	IPC      1.292
	Retire   0.665	(66.5%)
	FrontEnd 0.169	(16.9%)
	Spec     0.232	(23.2%)
	Backend  -0.067	(-6.7%)
	Elapsed  60.28
	Procs    10
	Maxrss   44K
	Minflt   2098220
	Majflt   0
	Inblock  0
	Oublock  16
	Msgsnd   0
	Msgrcv   0
	Nsignals 0
	Nvcsw    1631	(49.1%)
	Nivcsw   1693
	Utime    118.890738
	Stime    2.699423
	Start    584231.78
	Finish   584292.06
sh - pid 32164
	On_CPU   0.125
	On_Core  1.000
	IPC      1.251
	Retire   0.898	(89.8%)
	FrontEnd 0.279	(27.9%)
	Spec     0.178	(17.8%)
	Backend  -0.355	(-35.5%)
	Elapsed  60.38
	Procs    3
	Maxrss   94K
	Minflt   2255789
	Majflt   0
	Inblock  0
	Oublock  16
	Msgsnd   0
	Msgrcv   0
	Nsignals 0
	Nvcsw    18	(19.4%)
	Nivcsw   75
	Utime    58.004811
	Stime    2.375055
	Start    584422.54
	Finish   584482.92
Metrics (AMD) - phoronix/graphics-magick
As a whole, the IPC for AMD is higher
phoronix-test-s - pid 32174
	On_CPU   0.166
	On_Core  2.653
	IPC      1.795
	FrontCyc 0.053	(5.3%)
	BackCyc  0.165	(16.5%)
	Elapsed  949.23
	Procs    512
	Maxrss   448K
	Minflt   49085597
	Majflt   0
	Inblock  0
	Oublock  1048
	Msgsnd   0
	Msgrcv   0
	Nsignals 0
	Nvcsw    76644	(24.2%)
	Nivcsw   240353
	Utime    2447.632655
	Stime    70.947529
	Start    591984.20
	Finish   592933.43
Here are the individual workloads:
sh - pid 32431 // blur
	On_CPU   0.155
	On_Core  2.481
	IPC      1.794
	FrontCyc 0.105	(10.5%)
	BackCyc  0.192	(19.2%)
	Elapsed  60.18
	Procs    18
	Maxrss   125K
	Minflt   4840609
	Majflt   0
	Inblock  0
	Oublock  16
	Msgsnd   0
	Msgrcv   0
	Nsignals 0
	Nvcsw    7869	(35.1%)
	Nivcsw   14543
	Utime    143.460783
	Stime    5.874343
	Start    591987.20
	Finish   592047.38
sh - pid 32488 // sharpen
	On_CPU   0.358
	On_Core  5.728
	IPC      1.854
	FrontCyc 0.016	(1.6%)
	BackCyc  0.131	(13.1%)
	Elapsed  60.21
	Procs    18
	Maxrss   85K
	Minflt   3314590
	Majflt   0
	Inblock  0
	Oublock  16
	Msgsnd   0
	Msgrcv   0
	Nsignals 0
	Nvcsw    4053	(11.1%)
	Nivcsw   32582
	Utime    339.881471
	Stime    4.973636
	Start    592178.15
	Finish   592238.36
sh - pid 32547 // resize
	On_CPU   0.175
	On_Core  2.794
	IPC      1.768
	FrontCyc 0.088	(8.8%)
	BackCyc  0.162	(16.2%)
	Elapsed  60.16
	Procs    18
	Maxrss   383K
	Minflt   2861061
	Majflt   0
	Inblock  0
	Oublock  16
	Msgsnd   0
	Msgrcv   0
	Nsignals 0
	Nvcsw    6246	(27.2%)
	Nivcsw   16686
	Utime    161.985703
	Stime    6.113844
	Start    592369.02
	Finish   592429.18
sh - pid 32605 // HWB color space
	On_CPU   0.121
	On_Core  1.936
	IPC      1.649
	FrontCyc 0.044	(4.4%)
	BackCyc  0.222	(22.2%)
	Elapsed  60.18
	Procs    18
	Maxrss   44K
	Minflt   2235478
	Majflt   0
	Inblock  0
	Oublock  16
	Msgsnd   0
	Msgrcv   0
	Nsignals 0
	Nvcsw    6569	(38.0%)
	Nivcsw   10704
	Utime    113.145097
	Stime    3.340982
	Start    592559.69
	Finish   592619.87
sh - pid 32661 // local adaptive thresholding
	On_CPU   0.062
	On_Core  0.999
	IPC      1.817
	FrontCyc 0.049	(4.9%)
	BackCyc  0.188	(18.8%)
	Elapsed  60.31
	Procs    3
	Maxrss   94K
	Minflt   3113393
	Majflt   0
	Inblock  0
	Oublock  16
	Msgsnd   0
	Msgrcv   0
	Nsignals 0
	Nvcsw    18	(0.3%)
	Nivcsw   5489
	Utime    57.080858
	Stime    3.181444
	Start    592750.28
	Finish   592810.59
Process Tree - phoronix/graphics-magick
Process Tree
The process tree is fairly straightforward
    31991) sh
      31992) graphics-magick
        31993) gm
        31994) gm
        31995) gm
        31996) gm
        31997) gm
        31998) gm
        31999) gm
        32000) gm
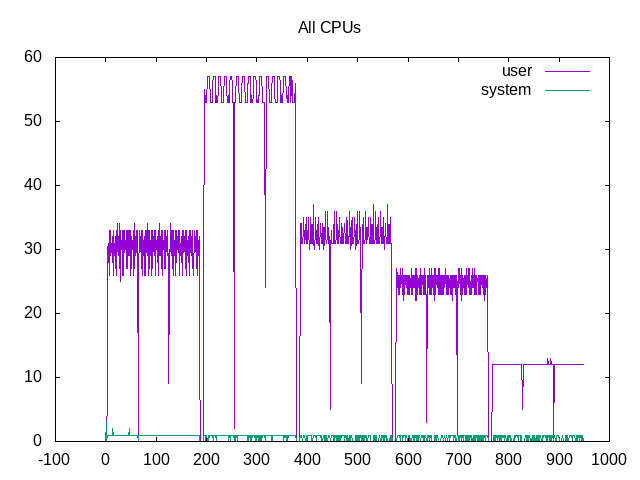
Looking at the sum of all time scheduled on cores shows sharpen with the highest percentage (~55%) and adapter threshold with the lowest (~14%) and others closer to the 25-35%.
 About this graph
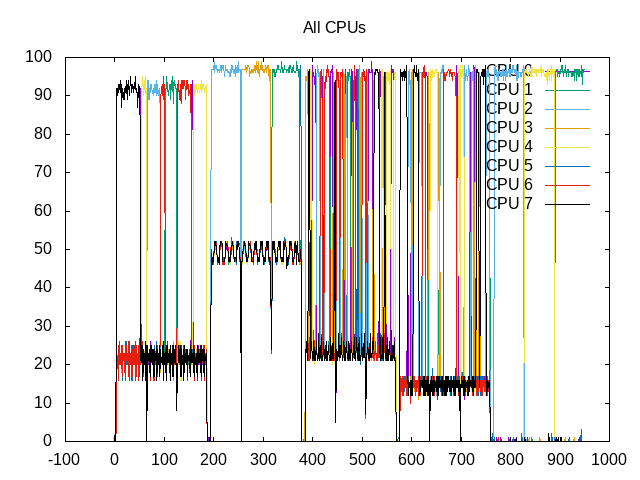
Separating this amongst cores shows some chaos of individual cores sometimes scheduled for close to 100% and other much lower. Looks like the algorithms have sequential parts and parallel parts.

The IPC of these various parts also have some chaos but interestingly some common high+low modes in each.
 About this graph
Topdown suggests for most the largest limiter are backend stalls with a moderate amount of bad speculation as well, particularly for the HWB color space application.
The overall topdown second-level metrics for the program:
retire         0.606
ms_uops                0.024
speculation    0.122
branch_misses          96.70%
machine_clears         3.30%
frontend       0.140
idq_uops_delivered_0   0.035
idq_uops_delivered_1   0.049
idq_uops_delivered_2   0.084
idq_uops_delivered_3   0.116
backend        0.133
resource_stalls.sb     0.014
stalls_ldm_pending     0.368
Moderately high speculation that appears to be branch misses. Not very high backend stalls and more likely memory reads.