
The Himeno benchmark is a linear solver of pressure Poisson using a point-Jacobi method.
A description of the overall benchmark is here and described in these slides.
The code has four different predefined grid sizes:
 Grid-size= XS (32x32x64)
	    S  (64x64x128)
	    M  (128x128x256)
	    L  (256x256x512)
	    XL (512x512x1024)
and the Phoronix program runs with the “s” grid size with following type output
mimax = 64 mjmax = 64 mkmax = 128
imax = 63 jmax = 63 kmax =127
 Start rehearsal measurement process.
 Measure the performance in 3 times.

 MFLOPS: 1830.141187 time(s): 0.025923 3.288628e-03

 Now, start the actual measurement process.
 The loop will be excuted in 6943 times
 This will take about one minute.
 Wait for a while

 Loop executed for 6943 times
 Gosa : 6.113893e-08
 MFLOPS measured : 1871.809420	cpu : 58.658930
 Score based on Pentium III 600MHz using Fortran 77: 22.826944
While parallel versions are available, the Phoronix variant uses a single-threaded C implementation and hence doesn’t really exercise either cores or caches.
For these runs all testing was done pinning to core 1.
Metrics (Intel) - phoronix/himeno
An interesting aspect of the benchmark is that it shows some noise in the amount of backend stalls. For example below are first successive runs:
sh - pid 8559
	On_CPU   0.125
	On_Core  1.000
	IPC      0.979
	Retire   0.325	(32.5%)
	FrontEnd 0.028	(2.8%)
	Spec     0.003	(0.3%)
	Backend  0.645	(64.5%)
	Elapsed  47.92
	Procs    3
	Maxrss   29K
	Minflt   7405
	Majflt   0
	Inblock  0
	Oublock  8
	Msgsnd   0
	Msgrcv   0
	Nsignals 0
	Nvcsw    18	(40.0%)
	Nivcsw   27
	Utime    47.911952
	Stime    0.008337
	Start    120898.16
	Finish   120946.08
and
sh - pid 8564
	On_CPU   0.125
	On_Core  1.000
	IPC      0.765
	Retire   0.254	(25.4%)
	FrontEnd 0.036	(3.6%)
	Spec     0.020	(2.0%)
	Backend  0.689	(68.9%)
	Elapsed  74.30
	Procs    3
	Maxrss   29K
	Minflt   7405
	Majflt   0
	Inblock  0
	Oublock  8
	Msgsnd   0
	Msgrcv   0
	Nsignals 0
	Nvcsw    18	(36.7%)
	Nivcsw   31
	Utime    74.278622
	Stime    0.013664
	Start    120947.08
	Finish   121021.38
Overall the particular code is 100% On_CPU and limited by backend stalls. Some aspect (cache placement?) causes some noise between runs affecting backend stalls and hence IPC.
Metrics (AMD) - phoronix/himenosh - pid 19774 On_CPU 0.062 On_Core 0.999 IPC 0.548 FrontCyc 0.035 (3.5%) BackCyc 0.011 (1.1%) Elapsed 59.67 Procs 3 Maxrss 29K Minflt 7407 Majflt 0 Inblock 0 Oublock 8 Msgsnd 0 Msgrcv 0 Nsignals 0 Nvcsw 18 (0.3%) Nivcsw 5742 Utime 59.604901 Stime 0.011988 Start 138173.41 Finish 138233.08
AMD runs have somewhat less variation than Intel. The IPC is also a fair amount lower. Phoronix benchmark run saw degradation on AMD between 16.04 and 18.04 but not Intel (gcc changes?).
Process Tree - phoronix/himeno
Process Tree
The process tree is simple
    8559) sh elapsed=47.92 start=2.66 finish=50.58
      8560) himeno elapsed=47.92 start=2.66 finish=50.58
        8561) himenobmtxpa elapsed=47.92 start=2.66 finish=50.58
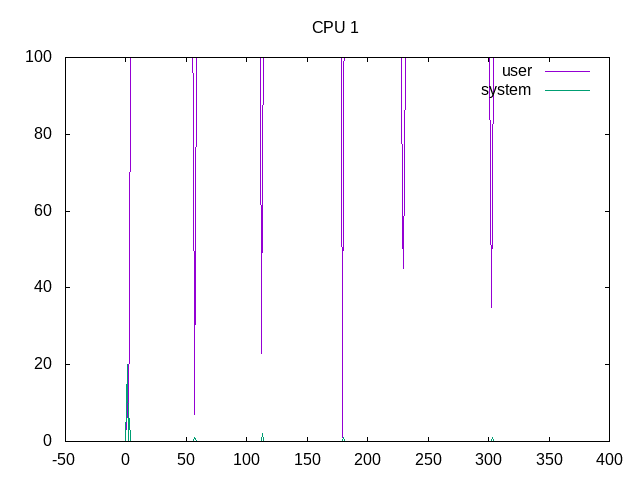
On_CPU is 100% overall.
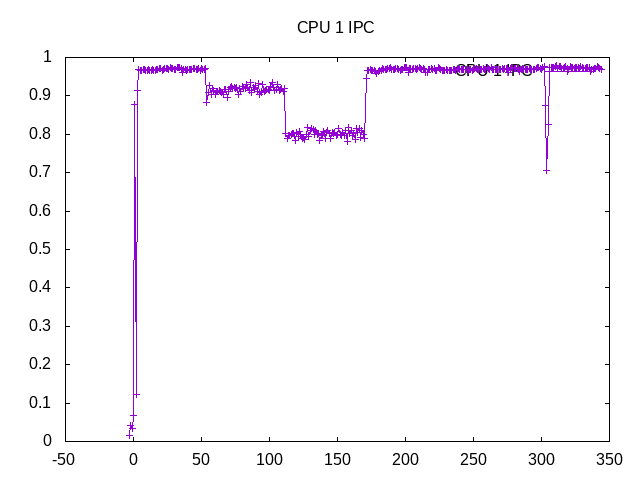
The IPC varies some by run, but overall is slightly less than 1.
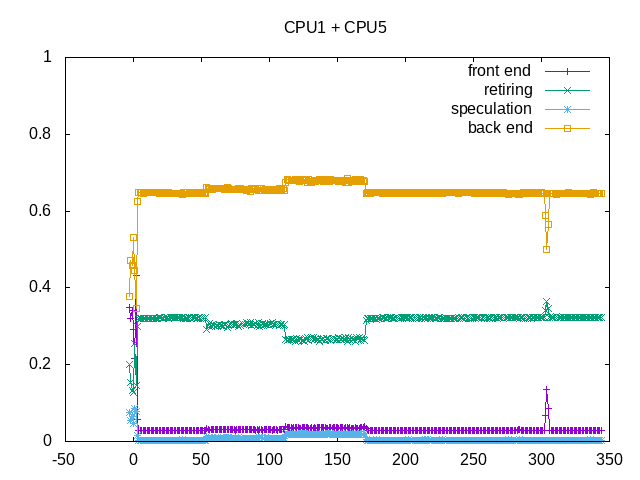
Backend stalls are the primary limiter. Runs between graphs are different, but also shows some run to run variations.
Next steps: Drill into backend stall issues, understand factors affecting run to run variations. Also understand AMD and Intel gaps in IPC as well as more recent AMD drop from Ubuntu 16.04 to 18.04.