
This test profile reports the total time of the different average timed test results from PyBench. PyBench reports average test times for different functions such as BuiltinFunctionCalls and NestedForLoops, with this total result providing a rough estimate as to Python’s average performance on a given system. This test profile runs PyBench each time for 20 rounds.
Here is what a run of the test looks like
prompt% python3 pybench.py -n 20
-------------------------------------------------------------------------------
PYBENCH 2.0
-------------------------------------------------------------------------------
* using CPython 3.6.5(default,Apr12018,05:46:30)[GCC7.3.0]
* disabled garbage collection
* system check interval set to maximum: 2147483647
* using timer: time.time

Calibrating tests. Please wait... done.

Running 20 round(s) of the suite at warp factor 10:

* Round 1 done in 1.480 seconds.
* Round 2 done in 1.512 seconds.
* Round 3 done in 1.480 seconds.
* Round 4 done in 1.506 seconds.
* Round 5 done in 1.478 seconds.
* Round 6 done in 1.488 seconds.
* Round 7 done in 1.480 seconds.
* Round 8 done in 1.482 seconds.
* Round 9 done in 1.479 seconds.
* Round 10 done in 1.487 seconds.
* Round 11 done in 1.481 seconds.
* Round 12 done in 1.514 seconds.
* Round 13 done in 1.494 seconds.
* Round 14 done in 1.481 seconds.
* Round 15 done in 1.484 seconds.
* Round 16 done in 1.486 seconds.
* Round 17 done in 1.479 seconds.
* Round 18 done in 1.517 seconds.
* Round 19 done in 1.478 seconds.
* Round 20 done in 1.519 seconds.

-------------------------------------------------------------------------------
Benchmark: 2018-05-19 12:39:45
-------------------------------------------------------------------------------

    Rounds: 20
    Warp:   10
    Timer:  time.time

    Machine Details:
       Platform ID:    Linux-4.15.0-20-generic-x86_64-with-Ubuntu-18.04-bionic
       Processor:      x86_64

    Python:
       Implementation: CPython
       Executable:     /usr/bin/python3
       Version:        3.6.5
       Compiler:       GCC 7.3.0
       Bits:           64bit
       Build:          Apr  1 2018 05:46:30 (#default)
       Unicode:        UCS4


Test                             minimum  average  operation  overhead
-------------------------------------------------------------------------------
          BuiltinFunctionCalls:     48ms     49ms    0.10us    0.081ms
           BuiltinMethodLookup:     22ms     23ms    0.02us    0.095ms
                 CompareFloats:     22ms     22ms    0.02us    0.108ms
         CompareFloatsIntegers:     28ms     28ms    0.03us    0.081ms
               CompareIntegers:     27ms     28ms    0.02us    0.163ms
        CompareInternedStrings:     18ms     18ms    0.01us    0.412ms
                  CompareLongs:     16ms     16ms    0.02us    0.095ms
                CompareStrings:     18ms     18ms    0.02us    0.277ms
    ComplexPythonFunctionCalls:     32ms     32ms    0.16us    0.136ms
                 ConcatStrings:     20ms     21ms    0.04us    0.162ms
               CreateInstances:     35ms     36ms    0.32us    0.130ms
            CreateNewInstances:     26ms     27ms    0.32us    0.106ms
       CreateStringsWithConcat:     45ms     47ms    0.05us    0.273ms
                  DictCreation:     19ms     20ms    0.05us    0.110ms
             DictWithFloatKeys:     29ms     29ms    0.03us    0.205ms
           DictWithIntegerKeys:     27ms     28ms    0.02us    0.273ms
            DictWithStringKeys:     22ms     22ms    0.02us    0.273ms
                      ForLoops:     17ms     17ms    0.68us    0.023ms
                    IfThenElse:     20ms     20ms    0.01us    0.204ms
                   ListSlicing:     27ms     27ms    1.94us    0.018ms
                NestedForLoops:     21ms     24ms    0.02us    0.011ms
      NestedListComprehensions:     28ms     28ms    2.36us    0.027ms
          NormalClassAttribute:     68ms     68ms    0.06us    0.142ms
       NormalInstanceAttribute:     31ms     31ms    0.03us    0.143ms
           PythonFunctionCalls:     31ms     31ms    0.09us    0.081ms
             PythonMethodCalls:     40ms     41ms    0.18us    0.048ms
                     Recursion:     53ms     53ms    1.06us    0.136ms
                  SecondImport:      8ms      8ms    0.08us    0.053ms
           SecondPackageImport:      9ms      9ms    0.09us    0.053ms
         SecondSubmoduleImport:     20ms     20ms    0.20us    0.053ms
       SimpleComplexArithmetic:     18ms     18ms    0.02us    0.108ms
        SimpleDictManipulation:     61ms     62ms    0.05us    0.136ms
         SimpleFloatArithmetic:     17ms     18ms    0.01us    0.163ms
      SimpleIntFloatArithmetic:     19ms     19ms    0.01us    0.163ms
       SimpleIntegerArithmetic:     19ms     19ms    0.01us    0.163ms
      SimpleListComprehensions:     23ms     24ms    1.96us    0.027ms
        SimpleListManipulation:     23ms     23ms    0.02us    0.177ms
          SimpleLongArithmetic:     13ms     13ms    0.02us    0.087ms
                    SmallLists:     30ms     30ms    0.04us    0.108ms
                   SmallTuples:     33ms     34ms    0.06us    0.122ms
         SpecialClassAttribute:     65ms     66ms    0.05us    0.143ms
      SpecialInstanceAttribute:     31ms     32ms    0.03us    0.143ms
                StringMappings:     63ms     65ms    0.26us    0.119ms
              StringPredicates:     44ms     46ms    0.07us    0.433ms
                 StringSlicing:     32ms     35ms    0.06us    0.232ms
                     TryExcept:     15ms     15ms    0.01us    0.204ms
                    TryFinally:     27ms     27ms    0.17us    0.109ms
                TryRaiseExcept:     11ms     11ms    0.17us    0.112ms
                  TupleSlicing:     32ms     32ms    0.12us    0.011ms
                   WithFinally:     34ms     34ms    0.21us    0.108ms
               WithRaiseExcept:     30ms     30ms    0.38us    0.137ms
-------------------------------------------------------------------------------
Totals:                           1465ms   1490ms
Phoronix runs 20 rounds (as above). The test themselves are single threaded and below were pinned to core 1.
Metrics (Intel) - phoronix/pybenchsh - pid 16105 On_CPU 0.125 On_Core 1.000 IPC 2.741 Retire 0.691 (69.1%) FrontEnd 0.156 (15.6%) Spec 0.036 (3.6%) Backend 0.117 (11.7%) Elapsed 34.01 Procs 6 Maxrss 19K Minflt 31704 Majflt 0 Inblock 0 Oublock 32 Msgsnd 0 Msgrcv 0 Nsignals 0 Nvcsw 44 (47.8%) Nivcsw 48 Utime 33.946269 Stime 0.067996 Start 389708.67 Finish 389742.68
The benchmark has a relatively high retirement percentage and IPC. Largest limiters are frontend stalls.
Metrics (AMD) - phoronix/pybenchsh - pid 12523 On_CPU 0.062 On_Core 1.000 IPC 2.461 FrontCyc 0.133 (13.3%) BackCyc 0.369 (36.9%) Elapsed 39.47 Procs 6 Maxrss 19K Minflt 6711 Majflt 0 Inblock 0 Oublock 32 Msgsnd 0 Msgrcv 0 Nsignals 0 Nvcsw 44 (1.1%) Nivcsw 3985 Utime 39.451417 Stime 0.000000 Start 399592.11 Finish 399631.58
Similar higher IPC on AMD as well.
Process Tree - phoronix/pybench
Process Tree
The process tree is simple
    16105) sh elapsed=34.01 start=2.68 finish=36.69
      16106) pybench elapsed=34.01 start=2.68 finish=36.69
        16107) python3 elapsed=34.01 start=2.68 finish=36.69
          16108) file elapsed=0.01 start=2.71 finish=2.72
          16109) sh elapsed=0.00 start=2.72 finish=2.72
            16110) uname elapsed=0.00 start=2.72 finish=2.72
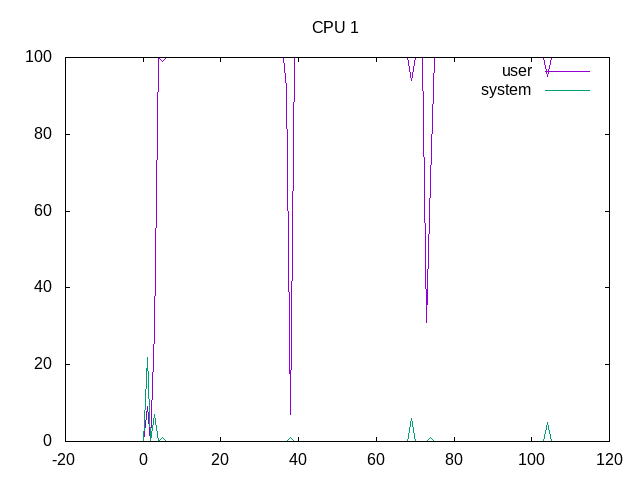
Almost 100% of a single core is scheduled for the benchmark.
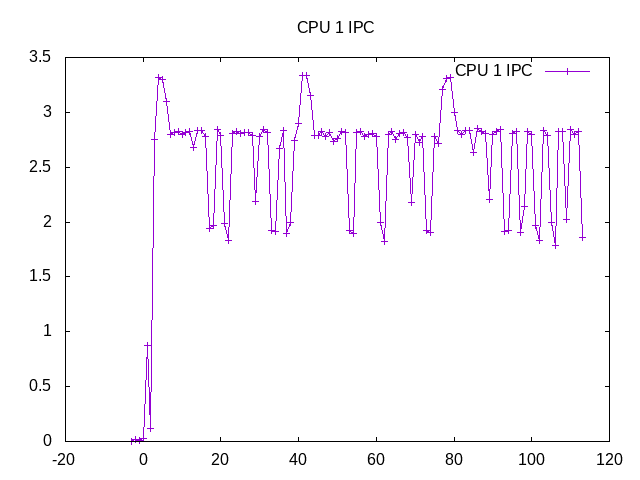
The IPC varies just a bit across this workload.
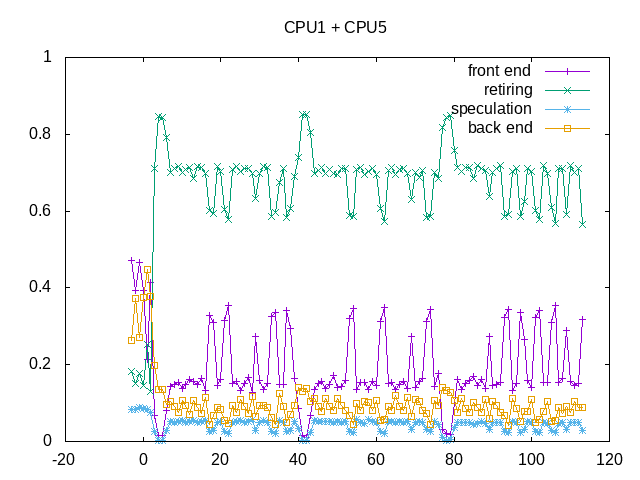
Variations seem to be correlated with frontend stalls.
According to this phoronix article performance on ubuntu 18.04 is slightly slower than ubuntu 16.04 for AMD and slightly faster for Intel.
Next steps: Why is performance improving on Intel and going down on AMD?