
Metrics (Intel) - phoronix/n-queensThis is a test of the OpenMP version of a test that solves the N-queens problem. The board problem size is 18.
sh - pid 26949
	On_CPU   1.000
	On_Core  7.998
	IPC      1.096
	Retire   0.502	(50.2%)
	FrontEnd 0.035	(3.5%)
	Spec     0.395	(39.5%)
	Backend  0.068	(6.8%)
	Elapsed  34.94
	Procs    10
	Maxrss   10K
	Minflt   261
	Majflt   0
	Inblock  0
	Oublock  16
	Msgsnd   0
	Msgrcv   0
	Nsignals 0
	Nvcsw    55	(3.5%)
	Nivcsw   1512
	Utime    279.424005
	Stime    0.011999
	Start    762166.05
	Finish   762200.99
The program is On_CPU for 100%. Interesting to see such a high amount of speculative misses.
Metrics (AMD) - phoronix/n-queenssh - pid 20321 On_CPU 0.999 On_Core 15.982 IPC 1.165 FrontCyc 0.011 (1.1%) BackCyc 0.097 (9.7%) Elapsed 17.99 Procs 18 Maxrss 10K Minflt 282 Majflt 0 Inblock 0 Oublock 16 Msgsnd 0 Msgrcv 0 Nsignals 0 Nvcsw 98 (0.4%) Nivcsw 27853 Utime 287.521327 Stime 0.000633 Start 10663.92 Finish 10681.91
Process Tree - phoronix/n-queens
Process Tree
The process tree is simple
    26949) sh
      26950) n-queens
        26951) qn24b_openmp
        26952) qn24b_openmp
        26953) qn24b_openmp
        26954) qn24b_openmp
        26955) qn24b_openmp
        26956) qn24b_openmp
        26957) qn24b_openmp
        26958) qn24b_openmp
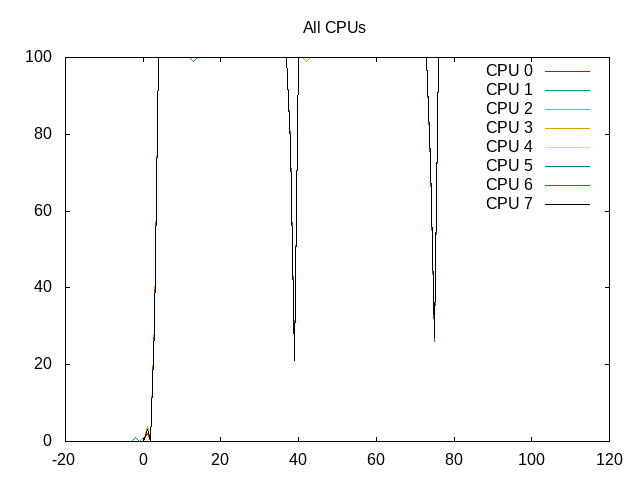 About this graph
Overall shows all cores scheduled to run n-queens.
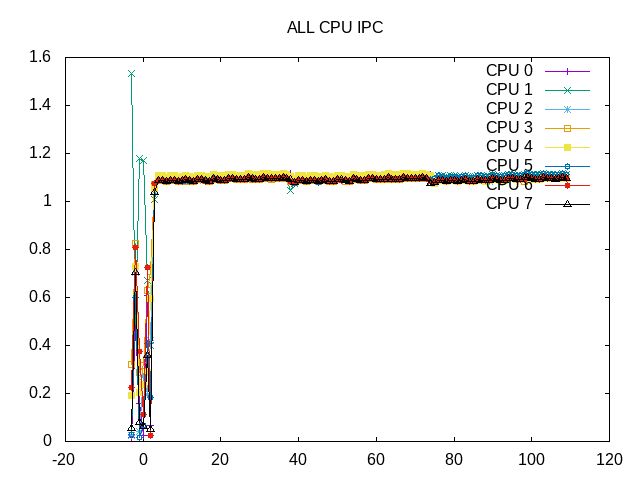
An IPC of ~1.1 overall.
 About this graph
Bad speculation is the largest issue and not much problem with stalls.
retire         0.502
ms_uops                0.000
speculation    0.394
branch_misses          99.98%
machine_clears         0.02%
frontend       0.036
idq_uops_delivered_0   0.002
idq_uops_delivered_1   0.008
idq_uops_delivered_2   0.022
idq_uops_delivered_3   0.039
backend        0.068
resource_stalls.sb     0.000
stalls_ldm_pending     0.116
The bad speculation appears to be branch misses.
Next steps: Understand branch misses in n-queens.