
Metrics (Intel) - phoronix/opensslOpenSSL is an open-source toolkit that implements SSL (Secure Sockets Layer) and TLS (Transport Layer Security) protocols. This test measures the RSA 4096-bit performance of OpenSSL.
openssl - pid 15104
	On_CPU   0.999
	On_Core  7.993
	IPC      1.656
	Retire   0.923	(92.3%)
	FrontEnd 0.065	(6.5%)
	Spec     0.006	(0.6%)
	Backend  0.006	(0.6%)
	Elapsed  20.03
	Procs    10
	Minflt   1417
	Majflt   0
	Utime    160.09  	(100.0%)
	Stime    0.00    	(0.0%)
	Start    445252.55
	Finish   445272.58
Metrics show this benchmark is among the highest at being scheduled on the CPU and retiring instructions.
The benchmark runs for approximately 20 seconds and is scheduled almost 100% of the time. More than 90% of the slots are retiring instructions with little time waiting for backend or frontend issues. The IPC is thus also correspondingly high.
sh - pid 6485
	On_CPU   0.998
	On_Core  15.970
	IPC      1.115
	FrontCyc 0.001	(0.1%)
	BackCyc  0.038	(3.8%)
	Elapsed  20.05
	Procs    19
	Minflt   2605
	Majflt   0
	Utime    320.20  	(100.0%)
	Stime    0.00    	(0.0%)
	Start    41101.61
	Finish   41121.66
Area to investigate further, why is IPC so much lower on AMD.
Process Tree - phoronix/openssl
Process Tree
The process tree is simple and symmetric. One process running on each core.
      15104) openssl elapsed=20.03 start=0.00 finish=20.03
        15105) openssl elapsed=20.03 start=0.00 finish=20.03
          15106) openssl elapsed=20.03 start=0.00 finish=20.03
          15107) openssl elapsed=20.02 start=0.00 finish=20.02
          15108) openssl elapsed=20.02 start=0.00 finish=20.02
          15109) openssl elapsed=20.02 start=0.00 finish=20.02
          15110) openssl elapsed=20.02 start=0.00 finish=20.02
          15111) openssl elapsed=20.02 start=0.00 finish=20.02
          15112) openssl elapsed=20.02 start=0.00 finish=20.02
          15113) openssl elapsed=20.03 start=0.00 finish=20.03
 About this graph
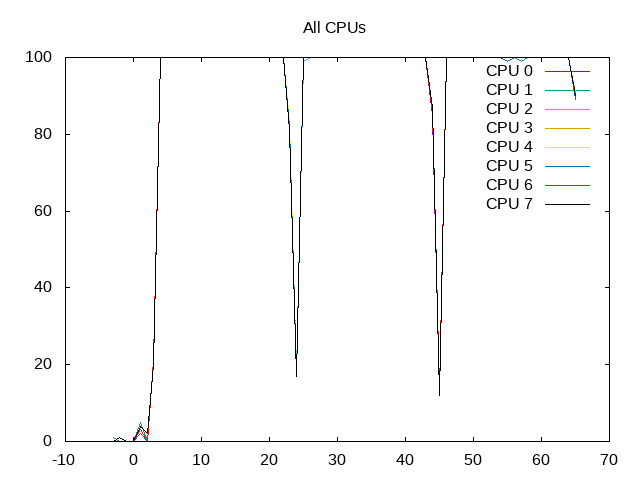
All cores are scheduled.
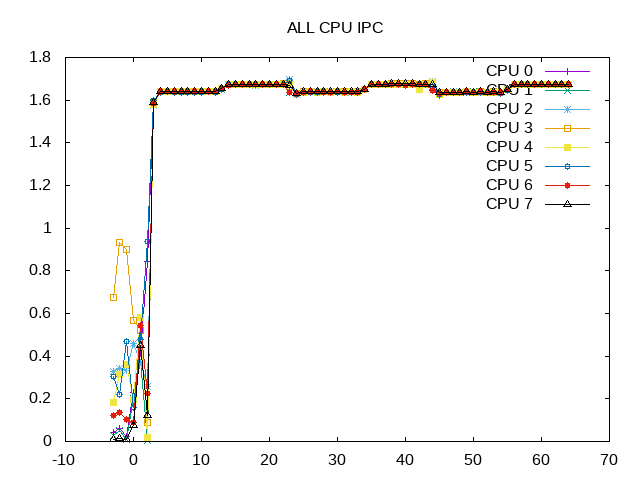
Very high IPC.
 About this graph
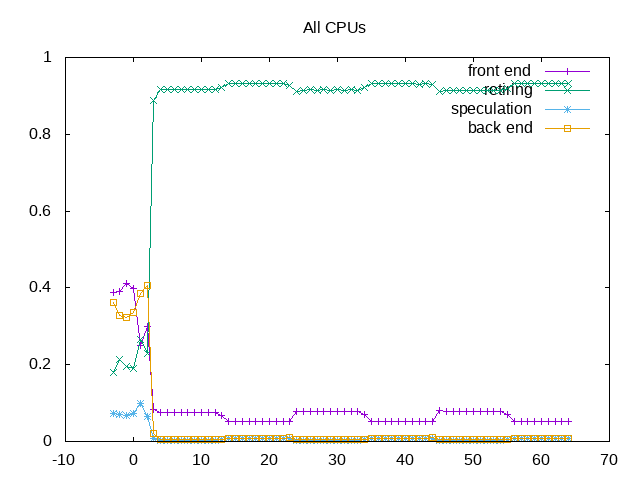
Top down plot shows >90% of slots retired. There seem to be two phases on each run.
Overall, this benchmark comes across as small and almost entirely retiring instructions. Not as interesting to investigate further bottlenecks but instead more a reference to compare with other workloads or other platforms.
Next steps: Why is the IPC on AMD lower than Intel? This benchmark shows some of the larger differences. Note: Further analysis suggests the MULX instruction plays a role here. See this blog post.