FFTW is a C subroutine library for computing the discrete Fourier transform (DFT) in one or more dimensions.
The fftw benchmark has the 32 total configurations to account for datatype, dimension and vector length. This can be seen with the following choices
FFTW 3.3.6:
    pts/fftw-1.2.0
    Processor Test Configuration
        1: Stock
        2: Float + SSE
        3: Test All Options
        Build: 2

        1:  1D FFT Size 32
        2:  1D FFT Size 64
        3:  1D FFT Size 128
        4:  1D FFT Size 256
        5:  1D FFT Size 512
        6:  1D FFT Size 1024
        7:  1D FFT Size 2048
        8:  1D FFT Size 4096
        9:  2D FFT Size 32
        10: 2D FFT Size 64
        11: 2D FFT Size 128
        12: 2D FFT Size 256
        13: 2D FFT Size 512
        14: 2D FFT Size 1024
        15: 2D FFT Size 2048
        16: 2D FFT Size 4096
        17: Test All Options
        Size:
The tests below were run with Float+SSE (choice 2) and 1D/2D Size 32/4096 (choices 1, 8, 9, 16).
fftw is sensitive to the memory size and the largest problems take much longer to run than the shorter vectors. Hence, in graphs below these mostly emphasize the 2D 4096 configuration.
Metrics (Intel) - phoronix/fftwsh - pid 27948 // 1D size=32 On_CPU 0.125 On_Core 1.000 IPC 3.076 Retire 0.646 (64.6%) FrontEnd 0.051 (5.1%) Spec 0.163 (16.3%) Backend 0.140 (14.0%) Elapsed 3.88 Procs 3 Maxrss 10K Minflt 501 Majflt 0 Inblock 0 Oublock 16 Msgsnd 0 Msgrcv 0 Nsignals 0 Nvcsw 18 (66.7%) Nivcsw 9 Utime 3.878980 Stime 0.000000 Start 194472.43 Finish 194476.31 sh - pid 27959 // 1D 4096 On_CPU 0.125 On_Core 1.000 IPC 2.733 Retire 0.569 (56.9%) FrontEnd 0.024 (2.4%) Spec 0.147 (14.7%) Backend 0.261 (26.1%) Elapsed 3.46 Procs 3 Maxrss 10K Minflt 499 Majflt 0 Inblock 0 Oublock 16 Msgsnd 0 Msgrcv 0 Nsignals 0 Nvcsw 18 (69.2%) Nivcsw 8 Utime 3.458698 Stime 0.000185 Start 194494.08 Finish 194497.54 sh - pid 27970 // 2D size=32 On_CPU 0.125 On_Core 0.999 IPC 2.421 Retire 0.499 (49.9%) FrontEnd 0.083 (8.3%) Spec 0.141 (14.1%) Backend 0.277 (27.7%) Elapsed 6.98 Procs 3 Maxrss 10K Minflt 2040 Majflt 0 Inblock 0 Oublock 16 Msgsnd 0 Msgrcv 0 Nsignals 0 Nvcsw 18 (60.0%) Nivcsw 12 Utime 6.972020 Stime 0.000200 Start 194514.23 Finish 194521.21 sh - pid 27982 // 2D size 4096 On_CPU 0.125 On_Core 1.000 IPC 1.375 Retire 0.269 (26.9%) FrontEnd 0.023 (2.3%) Spec 0.073 (7.3%) Backend 0.635 (63.5%) Elapsed 401.14 Procs 3 Maxrss 136K Minflt 35395 Majflt 0 Inblock 0 Oublock 16 Msgsnd 0 Msgrcv 0 Nsignals 0 Nvcsw 18 (11.5%) Nivcsw 139 Utime 401.109855 Stime 0.027999 Start 194545.13 Finish 194946.27
Notice how the elapsed time of 400 seconds for 4096 2D is much larger than the other three combined (3,3,6 seconds). The IPC for the smaller sizes are very high. For the largest size, the overall IPC drops and as will show below, there are also phases.
Metrics (AMD) - phoronix/fftwsh - pid 10083 // 1D, size=32 On_CPU 0.062 On_Core 0.999 IPC 3.400 FrontCyc 0.023 (2.3%) BackCyc 0.019 (1.9%) Elapsed 3.40 Procs 3 Maxrss 12K Minflt 505 Majflt 0 Inblock 0 Oublock 16 Msgsnd 0 Msgrcv 0 Nsignals 0 Nvcsw 18 (5.2%) Nivcsw 325 Utime 3.396067 Stime 0.000000 Start 75657.43 Finish 75660.83 sh - pid 10094 // 1D, size=4096 On_CPU 0.063 On_Core 1.001 IPC 3.525 FrontCyc 0.014 (1.4%) BackCyc 0.013 (1.3%) Elapsed 2.91 Procs 3 Maxrss 12K Minflt 504 Majflt 0 Inblock 0 Oublock 16 Msgsnd 0 Msgrcv 0 Nsignals 0 Nvcsw 18 (5.8%) Nivcsw 290 Utime 2.912079 Stime 0.000092 Start 75677.64 Finish 75680.55 sh - pid 10105 // 2D size 32 On_CPU 0.063 On_Core 1.001 IPC 2.523 FrontCyc 0.073 (7.3%) BackCyc 0.120 (12.0%) Elapsed 7.38 Procs 3 Maxrss 12K Minflt 2151 Majflt 0 Inblock 0 Oublock 16 Msgsnd 0 Msgrcv 0 Nsignals 0 Nvcsw 18 (2.4%) Nivcsw 718 Utime 7.382401 Stime 0.001321 Start 75696.41 Finish 75703.79 sh - pid 10116 // 2D size 4096 On_CPU 0.062 On_Core 0.999 IPC 1.131 FrontCyc 0.020 (2.0%) BackCyc 0.046 (4.6%) Elapsed 476.85 Procs 3 Maxrss 136K Minflt 35284 Majflt 0 Inblock 0 Oublock 16 Msgsnd 0 Msgrcv 0 Nsignals 0 Nvcsw 18 (0.0%) Nivcsw 46181 Utime 476.509827 Stime 0.027984 Start 75728.64 Finish 76205.49
AMD shows similar variation in IPC between workloads.
Process Tree - phoronix/fftw
Process Tree
The process tree is simple
    27982) sh
      27983) sh
        27984) bench

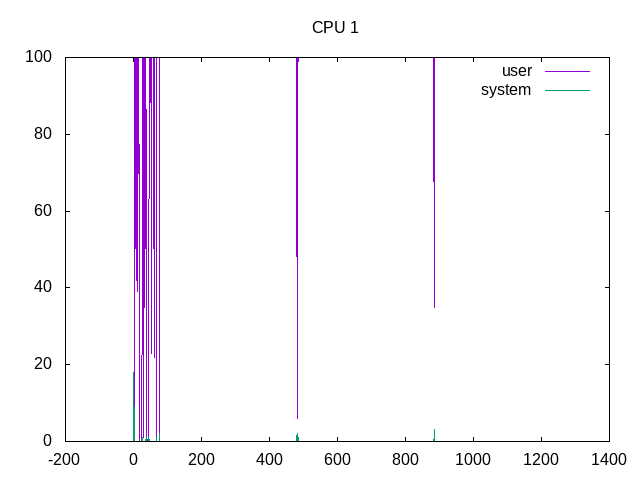
The tests run 100% scheduled on On_CPU.

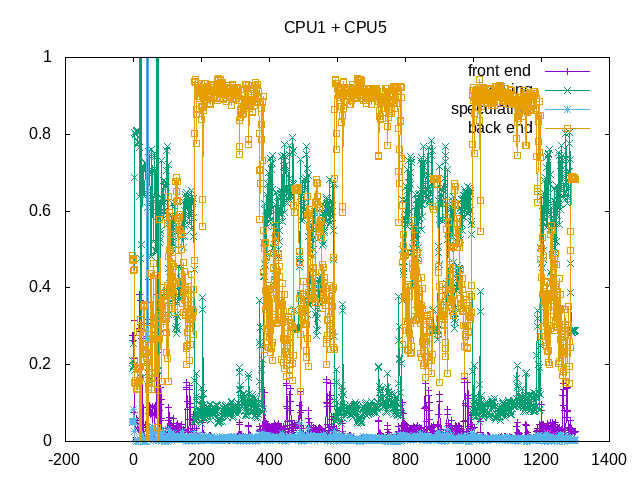
The workloads go through phases in IPC with some higher and some lower.

Backend stalls for memory are the key issue, as can be seen with phases the benchmark goes through.
on_cpu         0.122
elapsed        1298.759
utime          1263.195
stime          1263.195
nvcsw          1017 (48.82%)
nivcsw         1066 (51.18%)
inblock        0
inblock        952
retire         0.344
ms_uops                0.004
speculation    0.009
branch_misses          29.80%
machine_clears         70.20%
frontend       0.028
idq_uops_delivered_0   0.005
icache_stall               0.002
itlb_misses                0.000
idq_uops_delivered_1   0.007
idq_uops_delivered_2   0.016
idq_uops_delivered_3   0.029
dsb_ops                    69.39%
backend        0.620
resource_stalls.sb     0.069
stalls_ldm_pending     0.672
l2_refs                    0.031
l2_misses                  0.013
l2_miss_ratio              42.48%
l3_refs                    0.009
l3_misses                  0.005
l3_miss_ratio              53.13%
Backend memory stalls are the key limiter.
Next steps: Separate out individual workloads.
