
Metrics (Intel) - phoronix/compress-pbzip2This test measures the time needed to compress a file (a .tar package of the Linux kernel source code) using BZIP2 compression.
sh - pid 2426
	On_CPU   0.956
	On_Core  7.645
	IPC      0.913
	Retire   0.451	(45.1%)
	FrontEnd 0.098	(9.8%)
	Spec     0.300	(30.0%)
	Backend  0.151	(15.1%)
	Elapsed   9.71
	Procs    14
	Maxrss   740K
	Minflt   191115
	Majflt   0
	Inblock  0
	Oublock  0
	Msgsnd   0
	Msgrcv   0
	Nsignals 0
	Nvcsw    212	(21.7%)
	Nivcsw   763
	Utime    73.876767
	Stime    0.357475
	Start    743780.58
	Finish   743790.29
The voluntary context switches and On_CPU of 95% suggest some I/O (despite the Inblock/Oublock) but overall, this is scheduled mostly on the processor. The speculative miss rate is very high and the IPC slightly on the low side.
Metrics (AMD) - phoronix/compress-pbzip2sh - pid 6298 On_CPU 0.933 On_Core 14.931 IPC 0.928 FrontCyc 0.130 (13.0%) BackCyc 0.129 (12.9%) Elapsed 5.35 Procs 22 Maxrss 763K Minflt 198517 Majflt 0 Inblock 0 Oublock 0 Msgsnd 0 Msgrcv 0 Nsignals 0 Nvcsw 361 (4.3%) Nivcsw 8078 Utime 79.398898 Stime 0.480230 Start 753843.64 Finish 753848.99
Similar IPC between AMD and Intel.
Process Tree - phoronix/compress-pbzip2
Process Tree
The process tree is simple.
    2426) sh
      2427) compress-pbzip2
        2428) pbzip2
        2429) pbzip2
        2430) pbzip2
        2431) pbzip2
        2432) pbzip2
        2433) pbzip2
        2434) pbzip2
        2435) pbzip2
        2436) pbzip2
        2437) pbzip2
        2438) pbzip2
        2439) pbzip2
 About this graph
Shows all cores scheduled most of the time.
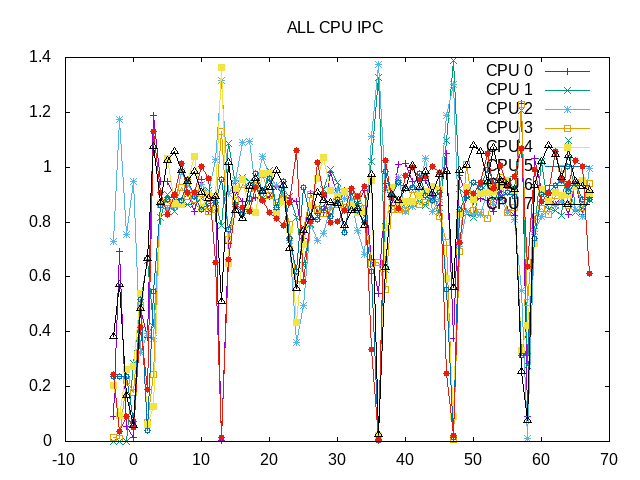
The IPC is somewhat lower and has some noise.
 About this graph
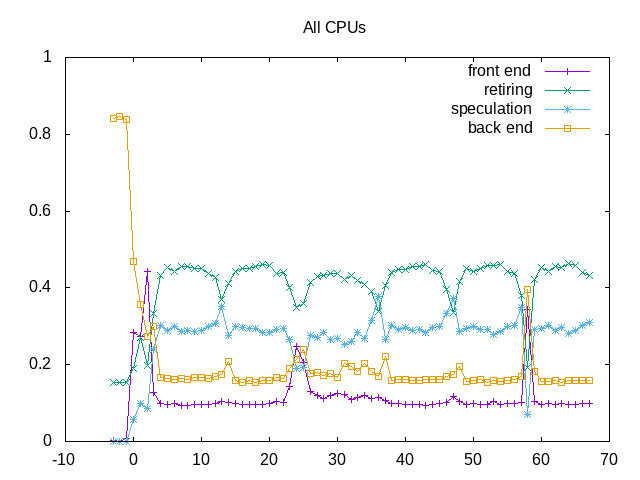
There is a high amount of speculative misses.
retire         0.443
ms_uops                0.002
speculation    0.296
branch_misses          81.24%
machine_clears         18.76%
frontend       0.100
idq_uops_delivered_0   0.023
idq_uops_delivered_1   0.037
idq_uops_delivered_2   0.054
idq_uops_delivered_3   0.085
backend        0.162
resource_stalls.sb     0.030
stalls_ldm_pending     0.236
Most of the bad speculation is due to branch prediction, but there are also machine clears.
Next steps: Understand why the branch prediction is poor.