
Below is a characterization of the gromacs binaries when run on the Lysozyme in water tutorial. For this tutorial, I followed the steps and then evaluated the “gmx mdrun” steps. These ran for 17 seconds (em), 6 minutes (nvt and npt) and 65 minutes (md).
As shown below, some things in common among all workloads
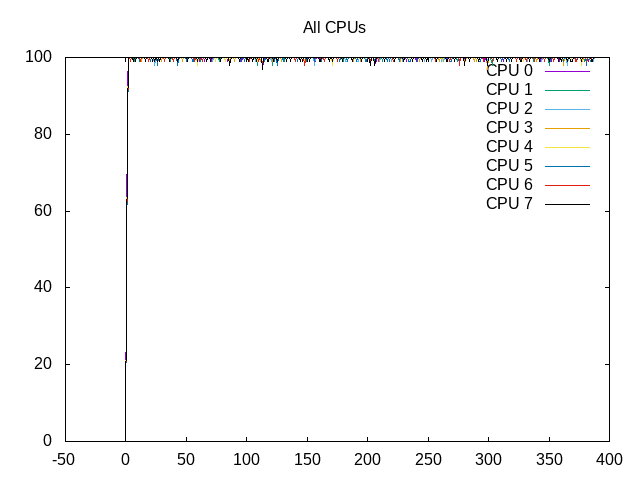
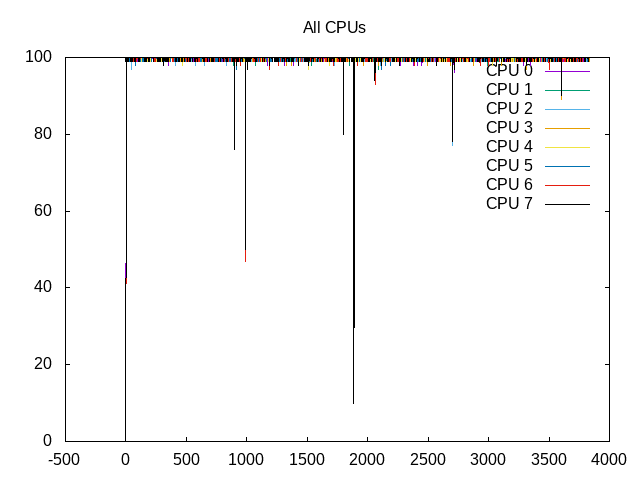
- On_CPU is close to 100%, particularly for longer runs
- Simple process tree structure, one process per OpenMP thread
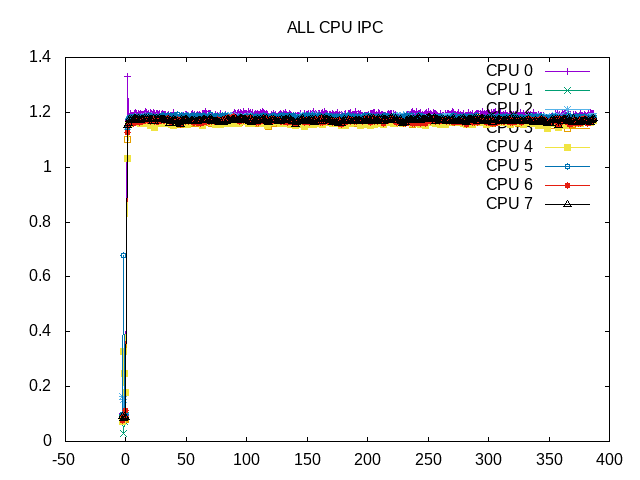
- IPC of ~1.18 on my Intel reference system
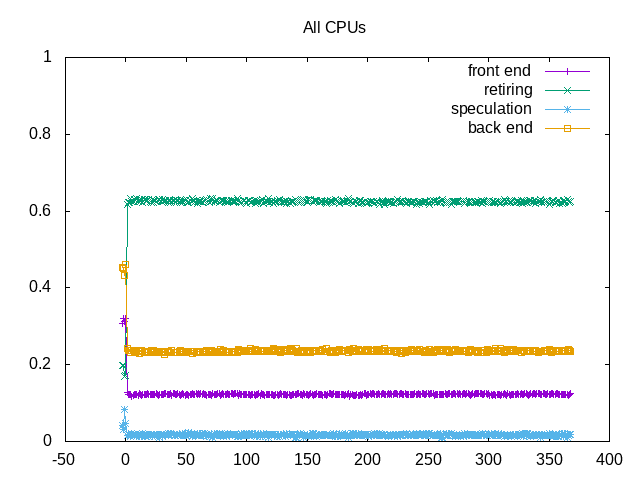
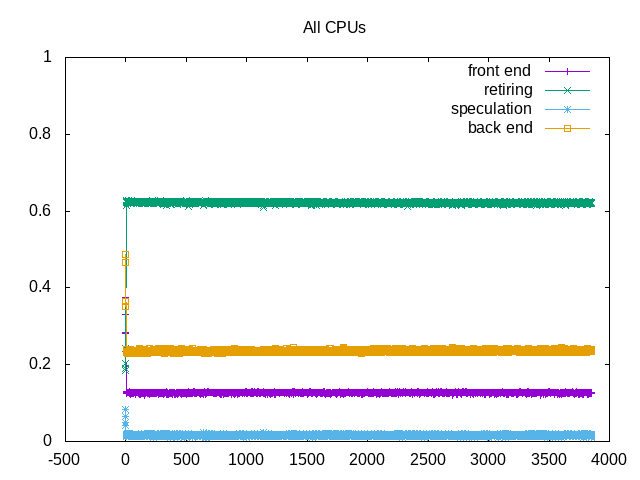
- Bad speculation ~14%, frontend stalls ~12%, backend stalls ~14%
- Some blocks written out
em process step
Metrics (Intel) - gromacs/lysozyme/em
mdrun1.sh - pid 10851
	On_CPU   0.952
	On_Core  7.617
	IPC      1.018
	Retire   0.424	(42.4%)
	FrontEnd 0.194	(19.4%)
	Spec     0.205	(20.5%)
	Backend  0.177	(17.7%)
	Elapsed  16.57
	Procs    9
	Maxrss   49K
	Minflt   12078
	Majflt   0
	Inblock  0
	Oublock  4792
	Msgsnd   0
	Msgrcv   0
	Nsignals 0
	Nvcsw    399	(31.4%)
	Nivcsw   872
	Utime    126.126171
	Stime    0.083965
	Start    124322.99
	Finish   124339.56
Runtime of 17 seconds with a small amount of I/O. IPC at 1.02 and a larger number of speculative misses.
Metrics (AMD) - gromacs/lysozyme/emmdrun1.sh - pid 21440 On_CPU 0.939 On_Core 15.025 IPC 0.840 FrontCyc 0.000 (0.0%) BackCyc 0.000 (0.0%) Elapsed 14.45 Procs 17 Maxrss 91K Minflt 21223 Majflt 0 Inblock 0 Oublock 4784 Msgsnd 0 Msgrcv 0 Nsignals 0 Nvcsw 7310 (24.9%) Nivcsw 22058 Utime 196.136759 Stime 20.968431 Start 1642593.81 Finish 1642608.26
IPC on AMD is slightly lower and the overall elapsed time is also lower but not 2x. Two cautions are the configuration required non-default build parameters for Ryzen and not 100% clear if more work might be done in the two instances. However, the nodes/second metrics are also consistent with the elapsed time.
Process Tree - gromacs/lysozyme/em
Process Tree
The process tree for this and others below is simple
10851) mdrun1.sh
  10853) gmx
  10854) gmx
  10855) gmx
  10856) gmx
  10857) gmx
  10858) gmx
  10859) gmx
  10860) gmx
 About this graph
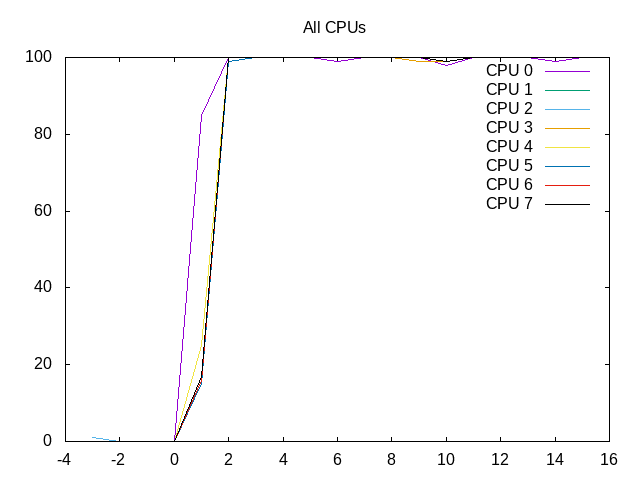
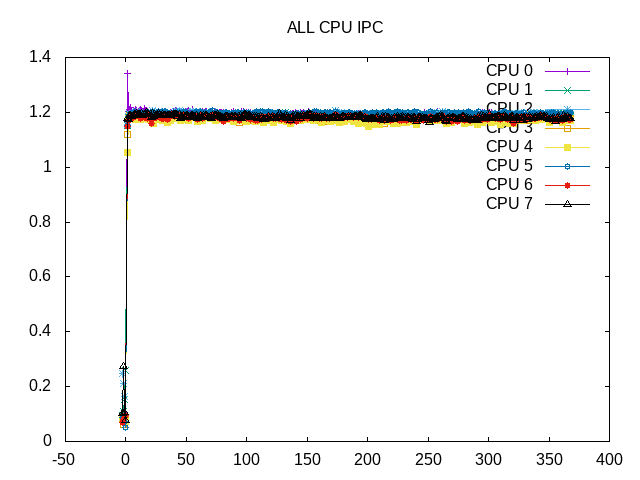
On_CPU percentage for em is close to 95%.
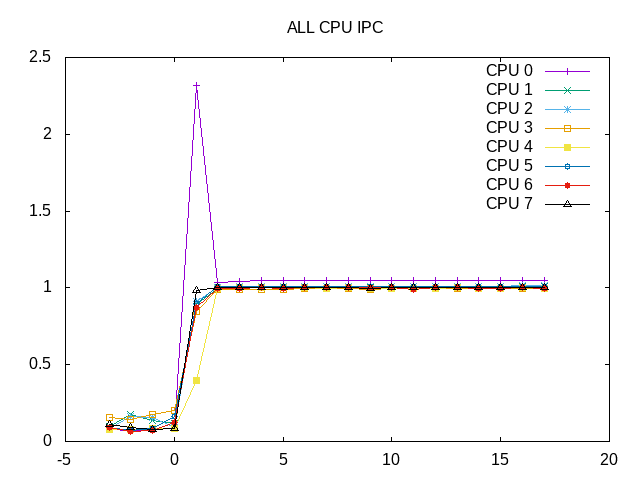
IPC is constant.
 About this graph
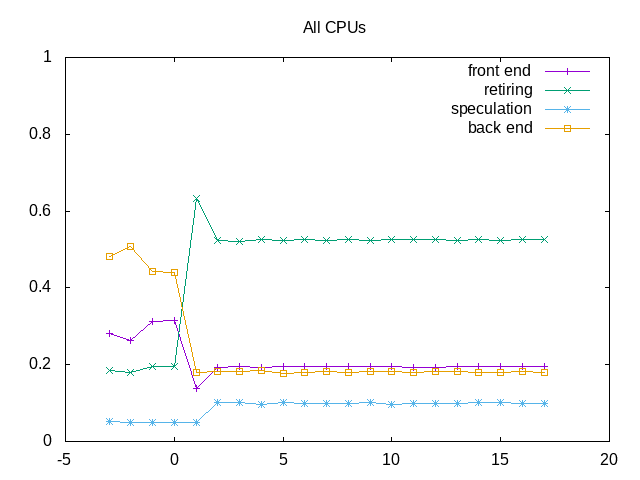
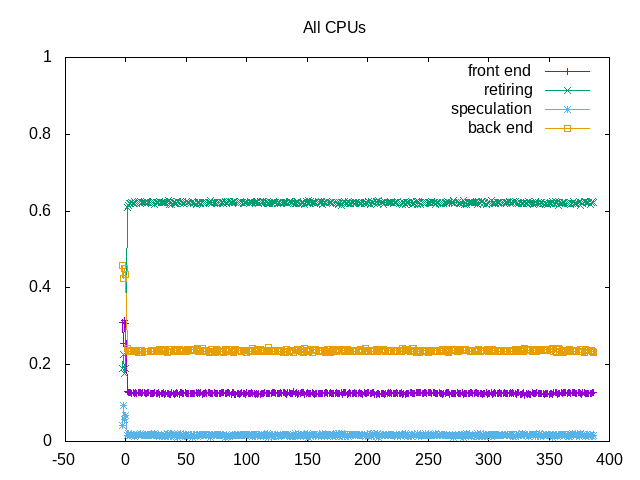
Topdown metrics also consistent.
nvt process step
Metrics (Intel) - gromacs/lysozyme/nvt
mdrun2.sh - pid 10869
	On_CPU   0.997
	On_Core  7.977
	IPC      1.185
	Retire   0.500	(50.0%)
	FrontEnd 0.122	(12.2%)
	Spec     0.142	(14.2%)
	Backend  0.236	(23.6%)
	Elapsed  366.99
	Procs    9
	Maxrss   48K
	Minflt   10805
	Majflt   0
	Inblock  0
	Oublock  167128
	Msgsnd   0
	Msgrcv   0
	Nsignals 0
	Nvcsw    1101	(6.3%)
	Nivcsw   16475
	Utime    2925.934264
	Stime    1.693728
	Start    124349.59
	Finish   124716.58
Runtime of six minutes with On_CPU almost 100%. IPC now slightly higher at 1.19 and fewer speculative misses at 14% and some more backend misses.
Metrics (AMD) - gromacs/lysozyme/nptmdrun3.sh - pid 21496 On_CPU 0.997 On_Core 15.958 IPC 0.780 FrontCyc 0.000 (0.0%) BackCyc 0.000 (0.0%) Elapsed 349.05 Procs 17 Maxrss 96K Minflt 22941 Majflt 0 Inblock 0 Oublock 167544 Msgsnd 0 Msgrcv 0 Nsignals 0 Nvcsw 7849 (1.4%) Nivcsw 559102 Utime 5400.079035 Stime 170.216282 Start 1642968.43 Finish 1643317.48
Similar lower IPC on this workload as well.
 About this graph
On_CPU percentage for nvt is close to 100%.
IPC is constant on this longer workload.
 About this graph
Topdown metrics are also consistent.
npt process step
Metrics (Intel) - gromacs/lysozyme/npt
mdrun3.sh - pid 10891
	On_CPU   0.997
	On_Core  7.978
	IPC      1.175
	Retire   0.497	(49.7%)
	FrontEnd 0.124	(12.4%)
	Spec     0.141	(14.1%)
	Backend  0.238	(23.8%)
	Elapsed  388.49
	Procs    9
	Maxrss   47K
	Minflt   11602
	Majflt   0
	Inblock  0
	Oublock  167160
	Msgsnd   0
	Msgrcv   0
	Nsignals 0
	Nvcsw    1359	(7.1%)
	Nivcsw   17768
	Utime    3098.082526
	Stime    1.393933
	Start    124726.61
	Finish   125115.10
Looks very similar to nvt, with runtime just over 6 minutes, IPC of 1.18 and speculative misses at 14%.
Metrics (AMD) - gromacs/lysozyme/nvtmdrun2.sh - pid 21466 On_CPU 0.997 On_Core 15.959 IPC 0.774 FrontCyc 0.000 (0.0%) BackCyc 0.000 (0.0%) Elapsed 340.09 Procs 17 Maxrss 95K Minflt 22628 Majflt 0 Inblock 0 Oublock 167480 Msgsnd 0 Msgrcv 0 Nsignals 0 Nvcsw 7659 (1.4%) Nivcsw 523541 Utime 5260.046864 Stime 167.353543 Start 1642618.28 Finish 1642958.37
Lower IPC on this workload as well.
 About this graph
On_CPU percentage for npt is close to 100%.
IPC is constant on this longer workload.
 About this graph
Topdown metrics are also consistent.
md process step
Metrics (Intel) - gromacs/lysozyme/md
mdrun4.sh - pid 10947
	On_CPU   0.999
	On_Core  7.988
	IPC      1.184
	Retire   0.500	(50.0%)
	FrontEnd 0.127	(12.7%)
	Spec     0.142	(14.2%)
	Backend  0.231	(23.1%)
	Elapsed  3835.49
	Procs    9
	Maxrss   47K
	Minflt   13867
	Majflt   0
	Inblock  0
	Oublock  207336
	Msgsnd   0
	Msgrcv   0
	Nsignals 0
	Nvcsw    5298	(2.9%)
	Nivcsw   178247
	Utime    30625.378482
	Stime    13.363845
	Start    125125.14
	Finish   128960.63
Runtime is now over an hour and otherwise similar to npt/nvt.
Metrics (AMD) - gromacs/lysozyme/mdmdrun4.sh - pid 21527 On_CPU 0.998 On_Core 15.961 IPC 0.767 FrontCyc 0.000 (0.0%) BackCyc 0.000 (0.0%) Elapsed 3516.32 Procs 17 Maxrss 61K Minflt 16793 Majflt 0 Inblock 0 Oublock 204160 Msgsnd 0 Msgrcv 0 Nsignals 0 Nvcsw 46760 (0.8%) Nivcsw 5683726 Utime 56111.511419 Stime 11.102982 Start 1643327.54 Finish 1646843.86
Consistent IPC on this workload as well.
 About this graph
On_CPU percentage for md is close to 100%.
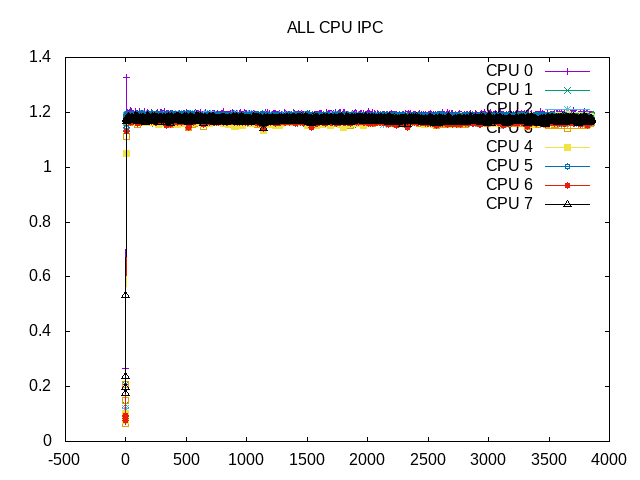
IPC is constant on this longer workload.
 About this graph
Topdown metrics are also consistent.
on_cpu         0.999
elapsed        3855.408
utime          30800.562
stime          12.747
nvcsw          3381 (2.66%)
nivcsw         123853 (97.34%)
inblock        0
onblock        207344
retire         0.620
ms_uops                0.007
speculation    0.017
branch_misses          69.23%
machine_clears         30.77%
frontend       0.127
idq_uops_delivered_0   0.055
icache_stall               0.004
itlb_misses                0.000
idq_uops_delivered_1   0.059
idq_uops_delivered_2   0.065
idq_uops_delivered_3   0.074
dsb_ops                    84.64%
backend        0.236
resource_stalls.sb     0.034
stalls_ldm_pending     0.167
l2_refs                    0.031
l2_misses                  0.006
l2_miss_ratio              20.92%
l3_refs                    0.002
l3_misses                  0.001
l3_miss_ratio              22.05%
Not sure why the end-to-end speculation numbers are lower than above (graphs suggest this one is correct). It does show 85% of the uops come from the uop cache and that icache or itlb misses are not a big factor – instead frontend stalls looks more like inefficient packing of uops. The backend stalls look like memory.