
This benchmark tests the system memory (RAM) performance.
STREAM is a copy of well-known benchmark available at STREAM.
Metrics (Intel) - phoronix/streamstream - pid 25745 On_CPU 0.990 On_Core 7.923 IPC 0.053 Retire 0.028 (2.8%) FrontEnd 0.016 (1.6%) Spec 0.002 (0.2%) Backend 0.955 (95.5%) Elapsed 50.08 Procs 10 Minflt 586203 Majflt 0 Utime 395.88 (99.8%) Stime 0.92 (0.2%) Start 512416.89 Finish 512466.97
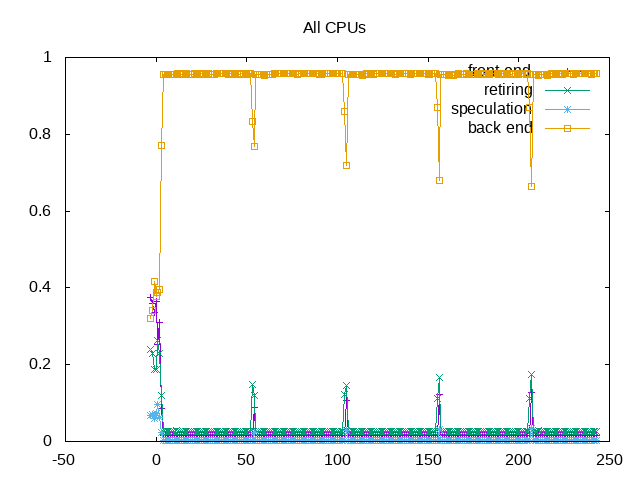
It isn’t particularly surprising that a benchmark to measure memory bandwidth spends almost all the time in the backend, waiting for memory. Instead what is interesting here is to (1) use STREAM as a calibration point for other workloads to understand how they compare (2) compare STREAM performance with underlying counters so can better understand what they measure and (3) use STREAM to understand the next steps of a “topdown” performance analysis. In particular that hierarchy separates backend-bound workloads into memory-bound vs core-bound and then further divides the memory-bound into L1, L2, L3, memory and stores-bound and introduces further metrics to measure these lower nodes.
Metrics (AMD) - phoronix/stream
sh - pid 3594
	On_CPU   0.987
	On_Core  15.786
	IPC      0.068
	FrontCyc 0.000	(0.0%)
	BackCyc  0.010	(1.0%)
	Elapsed  37.04
	Procs    18
	Minflt   586226
	Majflt   0
	Utime    582.08  	(99.5%)
	Stime    2.64    	(0.5%)
	Start    40690.83
	Finish   40727.87
Process Tree - phoronix/stream
Process Tree
   25745) sh elapsed=50.08 start=0.00 finish=50.08
      25746) stream elapsed=50.07 start=0.01 finish=50.08
        25747) stream-bin elapsed=49.97 start=0.01 finish=49.98
        25748) stream-bin elapsed=49.97 start=0.01 finish=49.98
        25749) stream-bin elapsed=49.97 start=0.01 finish=49.98
        25750) stream-bin elapsed=49.97 start=0.01 finish=49.98
        25751) stream-bin elapsed=49.97 start=0.01 finish=49.98
        25752) stream-bin elapsed=49.97 start=0.01 finish=49.98
        25753) stream-bin elapsed=49.97 start=0.01 finish=49.98
        25754) stream-bin elapsed=49.97 start=0.01 finish=49.98
The process tree is simple, by default, running one OpenMP thread on each core. Typically fewer copies could also be run as the limitation is memory.
 About this graph
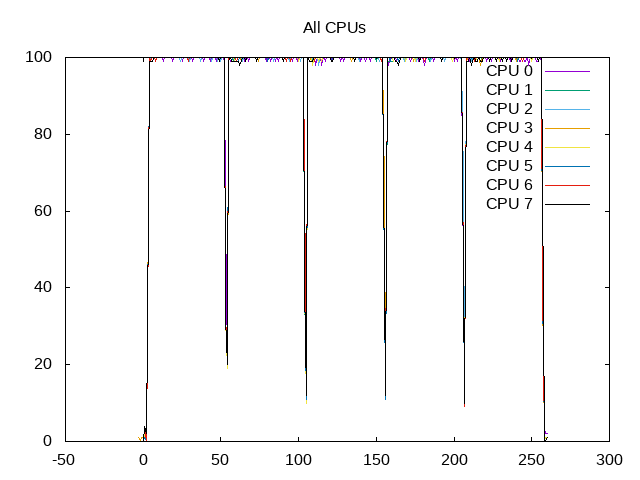
These workloads are scheduled almost 100% of the time. During the STREAM benchmark, four subsets are run:
Copy:  A = B
Scale: A = B * S
Add:   A = B + C
Triad: A = B * S + C
These tests are finely interleaved copying between the same arrays and hence it isn’t possible to separate out counters for each workload. The arrays for the operations above are much larger than the cache size and hence the workload constantly misses cache.
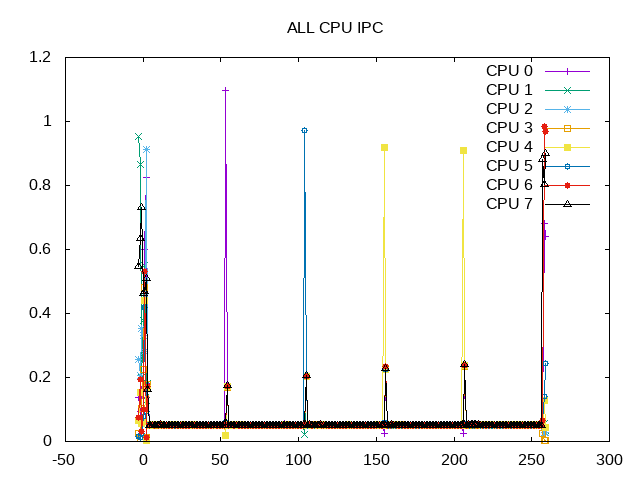
As expected, the IPC is low.
 About this graph
The STREAM result for my i7-4770 with 16 GB of DDR3 1600 MHz memory is ~16 GB/s.
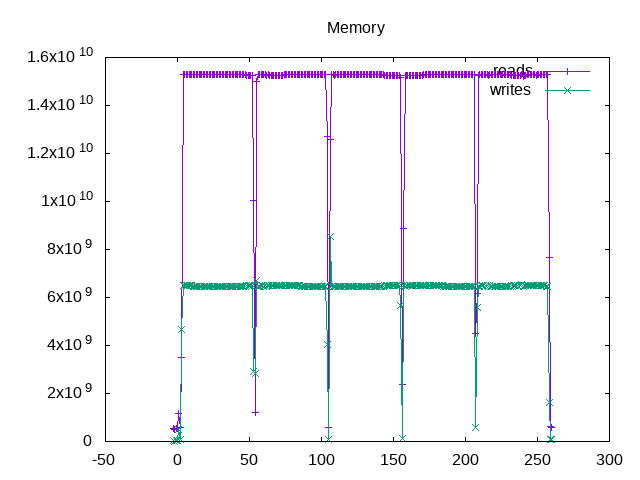
If I compare against the performance counters from the Intel Memory Controller (IMC), then I see a bandwidth of slightly over ~15 GB/s read traffic and ~6 GB/s write traffic. These are the IMC performance events multiplied by a 64-byte cache line size.
However, I can reconcile these numbers as follows:
- The four stream operations above include 6 memory reads and 4 memory writes and hence one might expect a ratio ~1.5 reads per write.
- However, the system has a write-back cache. This means when a miss occurs on a cache write, the system first reads in the full cache line before modifying the elements and writing it back. These ratios result in a ratio of ~2.5 reads per write.
- The extra 6 Gb/s of data reads for cache store misses are included in the counters, but don’t perform work that helps the overall STREAM score.
What I haven’t yet reconciled is the performance counters on the IMC as compared with the PERF_TYPE_HW_CACHE counters given in perf_event_open(2). If I measure the following four counters and sum them across all the cores.
Pattern: (perf_hw_cache_id)|(perf_hw_cache_op_id << 8)|(perf_hw_cache_op_result_id << 16)

L3_read_access  = PERF_COUNT_HW_CACHE_LL | (PERF_COUNT_HW_CACHE_OP_READ << 8)  | (PERF_COUNT_HW_CACHE_RESULT_ACCESS << 16)
L3_read_miss    = PERF_COUNT_HW_CACHE_LL | (PERF_COUNT_HW_CACHE_OP_READ << 8)  | (PERF_COUNT_HW_CACHE_RESULT_MISS << 16)
L3_write_access = PERF_COUNT_HW_CACHE_LL | (PERF_COUNT_HW_CACHE_OP_WRITE << 8) | (PERF_COUNT_HW_CACHE_RESULT_ACCESS << 16)
L3_write_miss   = PERF_COUNT_HW_CACHE_LL | (PERF_COUNT_HW_CACHE_OP_WRITE << 8) | (PERF_COUNT_HW_CACHE_RESULT_MISS << 16)
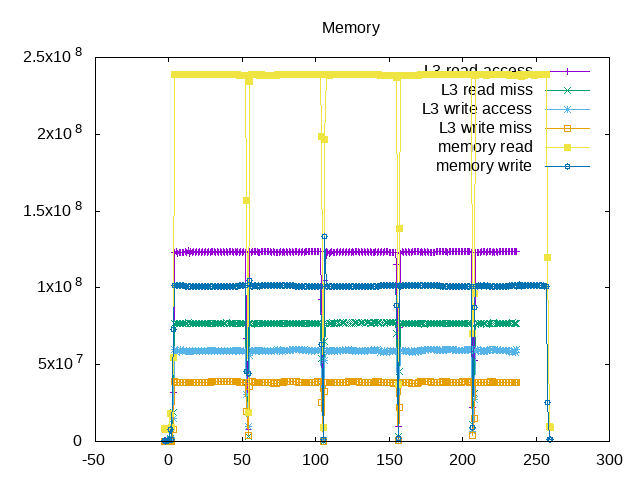
The ratio I see is ~240 million memory reads/second, ~100 million memory writes/second and only 77 million L3 read misses/second and 39 million L3 write misses/second. So somewhere it looks like things are off by a factor of ~3. Note: investigated this further and believe my counters are working as expected but that there isn't a direct correspondence between L3 misses and memory reads/writes.
 About this graph
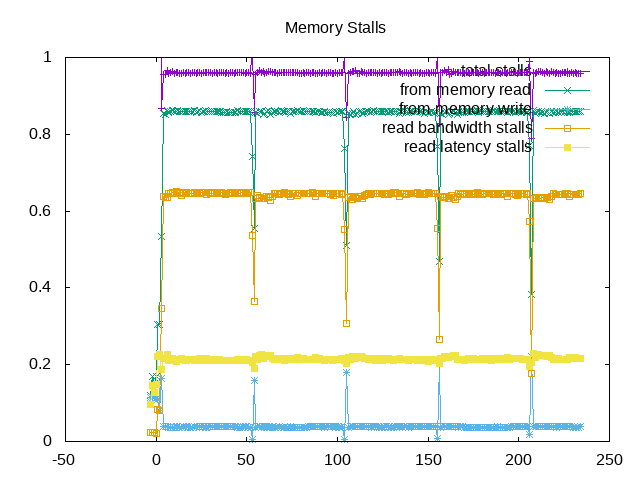
Looking at the next level of topdown analysis for memory; total stalls are well over 90% and of these >80% occur due to memory reads. Writes are not as large of an issue and read bandwidth is a larger issue than read latency.
Next steps:
Break down the topdown memory events further to look at L1, L2, L3 and main memory.