AOBench is a lightweight ambient occlusion renderer, written in C. The test profile is using a size of 2048 x 2048.
This benchmark is single-threaded and in test below was pinned to core 1.
Metrics (Intel) - phoronix/aobenchsh - pid 20676 On_CPU 0.125 On_Core 1.000 IPC 1.873 Retire 0.479 (47.9%) FrontEnd 0.119 (11.9%) Spec 0.108 (10.8%) Backend 0.294 (29.4%) Elapsed 44.66 Procs 3 Maxrss 110K Minflt 52474 Majflt 0 Inblock 0 Oublock 24592 Msgsnd 0 Msgrcv 0 Nsignals 0 Nvcsw 18 (22.5%) Nivcsw 62 Utime 44.607219 Stime 0.049716 Start 602663.25 Finish 602707.91
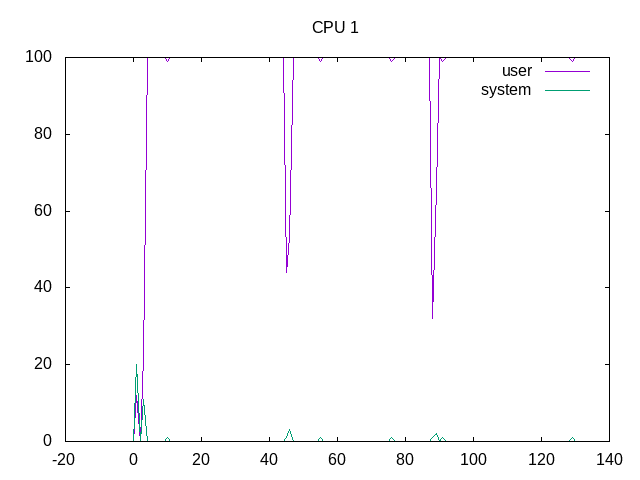
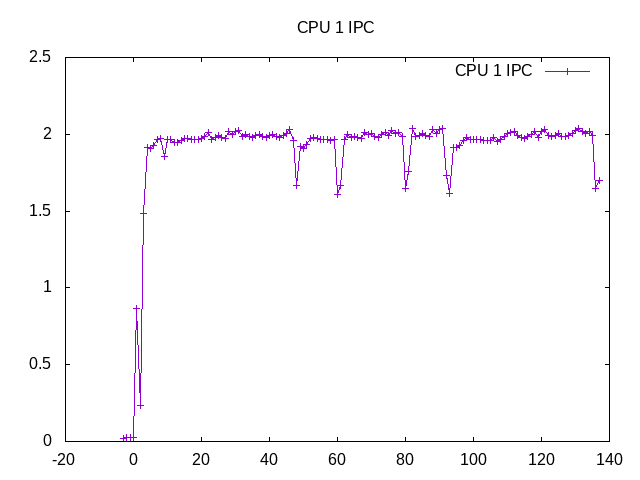
The process runs for 45 seconds and during that time is 100% using one core. There is a small bit of I/O as seen by voluntary context switches. Overall the program had a moderate IPC with the limiter being backend stalls.
Metrics (AMD) - phoronix/aobenchsh - pid 4155 On_CPU 0.062 On_Core 1.000 IPC 1.955 FrontCyc 0.091 (9.1%) BackCyc 0.114 (11.4%) Elapsed 44.40 Procs 3 Maxrss 110K Minflt 52473 Majflt 0 Inblock 0 Oublock 24592 Msgsnd 0 Msgrcv 0 Nsignals 0 Nvcsw 18 (0.4%) Nivcsw 4139 Utime 44.341937 Stime 0.035990 Start 612299.69 Finish 612344.09
AMD shows just slightly higher IPC.
Process Tree - phoronix/aobench
Process Tree
The process tree is simple.
    20676) sh
      20677) aobench
        20678) ao

Core 1 is 100% busy.

IPC is consistently just less than 2.

Backend stalls are largest issue and also a number of speculation misses.
retire         0.507
ms_uops                0.002
speculation    0.143
branch_misses          94.91%
machine_clears         5.09%
frontend       0.094
idq_uops_delivered_0   0.019
idq_uops_delivered_1   0.035
idq_uops_delivered_2   0.051
idq_uops_delivered_3   0.083
backend        0.255
resource_stalls.sb     0.002
stalls_ldm_pending     0.538
Overall metrics show topdown metrics including backend stalls most due to memory reads and also branch misses.
Next steps: None
