
Metrics (Intel) - phoronix/povrayThis is a test of POV-Ray, the Persistence of Vision Raytracer. POV-Ray is used to create 3D graphics using ray-tracing.
sh - pid 4433
	On_CPU   0.980
	On_Core  7.841
	IPC      1.299
	Retire   0.543	(54.3%)
	FrontEnd 0.229	(22.9%)
	Spec     0.155	(15.5%)
	Backend  0.072	(7.2%)
	Elapsed  134.57
	Procs    30
	Minflt   10840
	Majflt   0
	Utime    1054.79 	(100.0%)
	Stime    0.33    	(0.0%)
	Start    67208.77
	Finish   67343.34
This benchmark runs for approximately one minute. It has a relatively high proportion of both front-end and speculation times. Both are areas for further exploration. This is a much larger application than some of the small microbenchmarks, are icache and itlb factors here? Note: As described below I think the speculation is a tool problem as I investigate below.
prompt$ size povray
   text	   data	    bss	    dec	    hex	filename
3308040	 365648	 140592	3814280	 3a3388	povray
Metrics (AMD) - phoronix/povray
sh - pid 10133
	On_CPU   0.945
	On_Core  15.115
	IPC      1.420
	FrontCyc 0.056	(5.6%)
	BackCyc  0.062	(6.2%)
	Elapsed  67.23
	Procs    46
	Minflt   16165
	Majflt   0
	Utime    1016.11 	(100.0%)
	Stime    0.09    	(0.0%)
	Start    50130.55
	Finish   50197.78
Process Tree - phoronix/povray
Process Tree
A total of 30 processes are run as part of the application, some run for very short amounts of time.
    4433) sh elapsed=134.57 start=0.00 finish=134.57
      4434) povray elapsed=134.57 start=0.00 finish=134.57
        4435) povray elapsed=0.00 start=0.00 finish=0.00
        4436) povray elapsed=134.56 start=0.00 finish=134.56
        4437) povray elapsed=134.55 start=0.01 finish=134.56
        4438) povray elapsed=134.55 start=0.01 finish=134.56
        4439) povray elapsed=134.50 start=0.01 finish=134.51
        4440) povray elapsed=134.05 start=0.26 finish=134.31
        4441) povray elapsed=0.30 start=0.26 finish=0.56
        4442) povray elapsed=0.00 start=0.57 finish=0.57
        4443) povray elapsed=133.73 start=0.58 finish=134.31
        4444) povray elapsed=0.00 start=0.58 finish=0.58
        4445) povray elapsed=0.00 start=0.58 finish=0.58
        4446) povray elapsed=1.30 start=0.63 finish=1.93
        4447) povray elapsed=0.19 start=0.63 finish=0.82
        4448) povray elapsed=0.00 start=0.63 finish=0.63
        4449) povray elapsed=0.00 start=0.63 finish=0.63
        4450) povray elapsed=0.00 start=0.63 finish=0.63
        4451) povray elapsed=0.00 start=0.63 finish=0.63
        4452) povray elapsed=0.00 start=0.63 finish=0.63
        4453) povray elapsed=0.00 start=0.63 finish=0.63
        4454) povray elapsed=0.02 start=1.93 finish=1.95
        4455) povray elapsed=131.48 start=1.98 finish=133.46
        4456) povray elapsed=131.83 start=1.98 finish=133.81
        4457) povray elapsed=131.42 start=1.98 finish=133.40
        4458) povray elapsed=132.22 start=1.98 finish=134.20
        4459) povray elapsed=131.37 start=1.98 finish=133.35
        4460) povray elapsed=132.05 start=1.98 finish=134.03
        4461) povray elapsed=131.89 start=1.98 finish=133.87
        4462) povray elapsed=131.43 start=1.98 finish=133.41
 About this graph
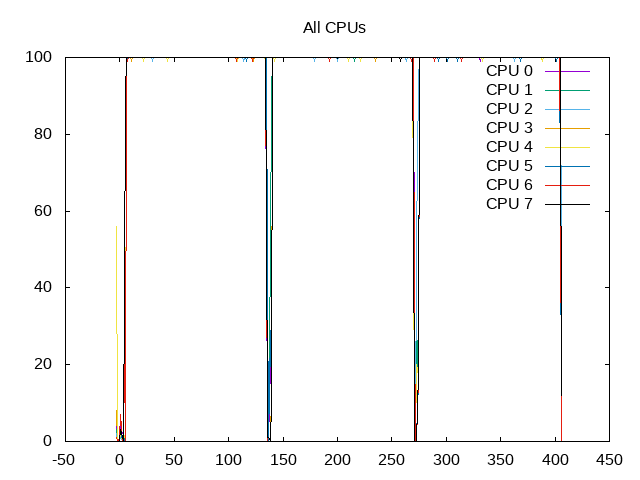
CPU utilization is close to 100% across all cores.
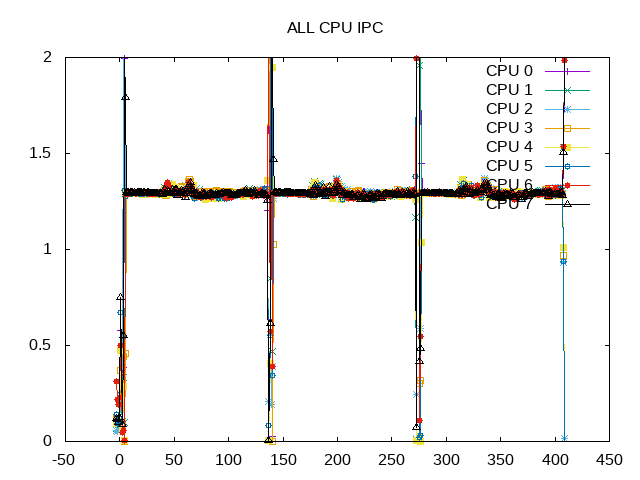
The IPC is 1.30
 About this graph
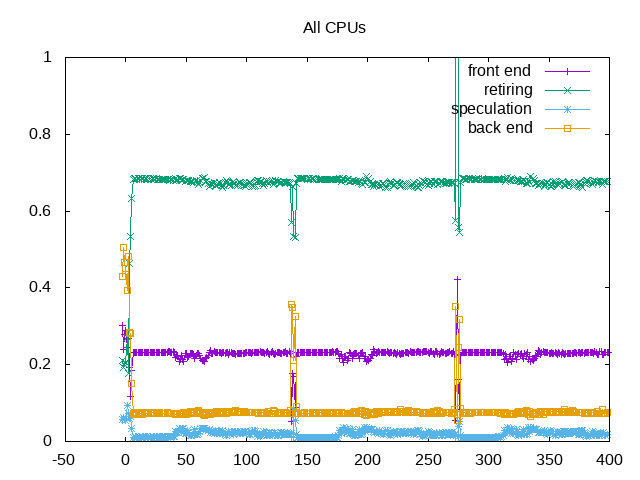
This shows results across three runs. The speculation numbers in this graph aren’t consistent with metric above, need to investigate further.
Next steps: Investigate integrity of the speculation numbers between the topdown and metrics. Investigate frontend events for this benchmark. There seem to be a few “spikes” of very high numbers in both groups and perf is more consistent with a lower number:
prompt% perf stat -a --topdown ./pbm.sh

 Performance counter stats for 'system wide':

                  retiring             bad speculation      frontend bound       backend bound
S0-C0           2     67.6%                2.0%               22.8%                7.7%
S0-C1           2     67.5%                2.0%               22.5%                8.1%
S0-C2           2     67.5%                2.0%               22.6%                7.9%
S0-C3           2     67.6%                1.9%               22.8%                7.7%

     133.380714246 seconds time elapsed