
This is a benchmark of BLAKE2 using the blake2s binary. BLAKE2 is a high-performance crypto alternative to MD5 and SHA-2/3.
The test is single-threaded. The overall runtime is fast and the test completes in less than 1/2 second. This means my graphs with granularity of 1 second don’t always capture everything.
Metrics (Intel) - phoronix/blake2sh - pid 8806 On_CPU 0.124 On_Core 0.992 IPC 1.405 Retire 0.280 (28.0%) FrontEnd 0.006 (0.6%) Spec 0.078 (7.8%) Backend 0.635 (63.5%) Elapsed 0.47 Procs 3 Maxrss 10K Minflt 238 Majflt 0 Inblock 0 Oublock 16 Msgsnd 0 Msgrcv 0 Nsignals 0 Nvcsw 18 (78.3%) Nivcsw 5 Utime 0.466015 Stime 0.000000 Start 524403.13 Finish 524403.60
On_Core is almost 100%, the IPC is 1.41 and backend stalls seem to be the largest issue.
Metrics (AMD) - phoronix/blake2sh - pid 6948 On_CPU 0.062 On_Core 0.996 IPC 0.891 FrontCyc 0.004 (0.4%) BackCyc 0.003 (0.3%) Elapsed 0.77 Procs 3 Maxrss 10K Minflt 241 Majflt 0 Inblock 0 Oublock 16 Msgsnd 0 Msgrcv 0 Nsignals 0 Nvcsw 18 (19.4%) Nivcsw 75 Utime 0.766571 Stime 0.000000 Start 407383.07 Finish 407383.84
IPC on my AMD system is considerably less.
Process Tree - phoronix/blake2
Process Tree
The process tree is simple
    8806) sh elapsed=0.47 start=2.69 finish=3.16
      8807) blake2 elapsed=0.46 start=2.70 finish=3.16
        8808) blake2s elapsed=0.46 start=2.70 finish=3.16
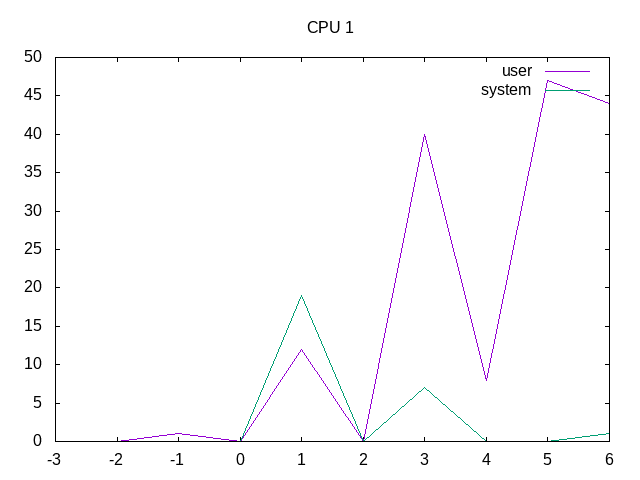
A little too much noise to see the On_Core of 100%.
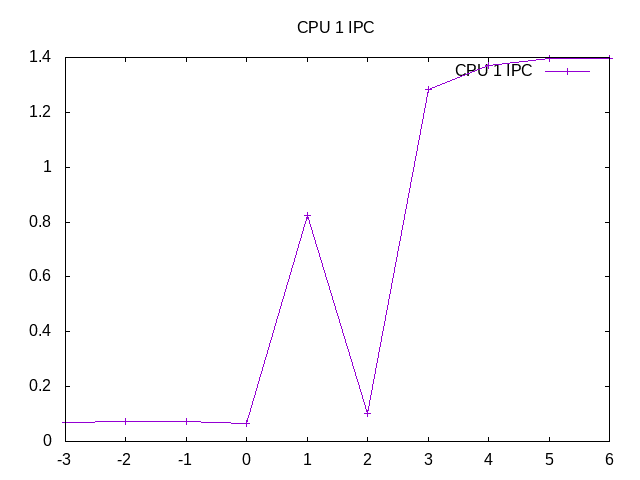
Similar noise with the IPC.
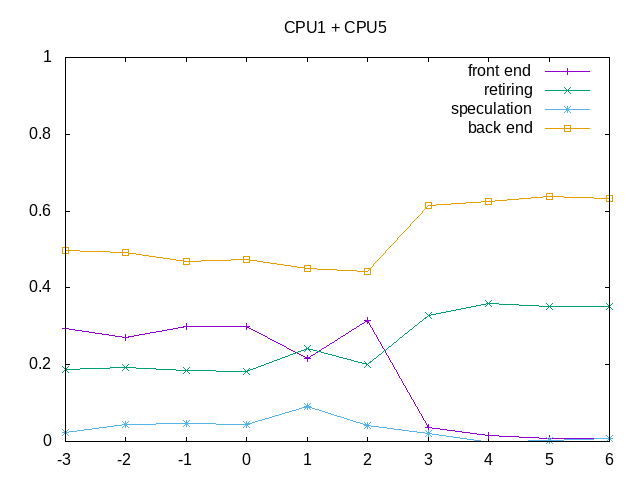
This is mostly the phoronix test suite running, but shows backend stalls.
on_cpu         0.041
elapsed        6.197
utime          1.817
stime          0.202
nvcsw          924 (97.67%)
nivcsw         22 (2.33%)
inblock        0
onblock        680
retire         0.358
ms_uops                0.015
speculation    0.021
branch_misses          51.68%
machine_clears         48.32%
frontend       0.077
idq_uops_delivered_0   0.035
icache_stall               0.009
itlb_misses                0.002
idq_uops_delivered_1   0.045
idq_uops_delivered_2   0.054
idq_uops_delivered_3   0.058
dsb_ops                    80.40%
backend        0.545
resource_stalls.sb     0.014
stalls_ldm_pending     0.602
l2_refs                    0.006
l2_misses                  0.003
l2_miss_ratio              61.13%
l3_refs                    0.002
l3_misses                  0.000
l3_miss_ratio              16.17%
Backend stalls correlated with cache misses.
Next steps: Understand why IPC on AMD is considerably lower than Intel.