
tjbench is a JPEG decompression/compression benchmark part of libjpeg-turbo.
This code is single-threaded and was run pinned to core 1.
Metrics (Intel) - phoronix/tjbenchsh - pid 7457 On_CPU 0.125 On_Core 1.000 IPC 2.557 Retire 0.534 (53.4%) FrontEnd 0.044 (4.4%) Spec 0.236 (23.6%) Backend 0.186 (18.6%) Elapsed 6.18 Procs 16 Maxrss 82K Minflt 22471 Majflt 0 Inblock 0 Oublock 16 Msgsnd 0 Msgrcv 0 Nsignals 0 Nvcsw 129 (67.5%) Nivcsw 62 Utime 6.155447 Stime 0.024053 Start 692342.22 Finish 692348.40
The On_Core is 100%. The IPC is high with a higher than average percent of bad speculation. As seen below, this seems to be branch mis-prediction. The runtime is only 6 seconds.
Metrics (AMD) - phoronix/tjbenchsh - pid 11480 On_CPU 0.063 On_Core 1.001 IPC 2.752 FrontCyc 0.000 (0.0%) BackCyc 0.000 (0.0%) Elapsed 6.10 Procs 16 Maxrss 82K Minflt 22501 Majflt 0 Inblock 0 Oublock 16 Msgsnd 0 Msgrcv 0 Nsignals 0 Nvcsw 129 (17.0%) Nivcsw 629 Utime 6.080309 Stime 0.024571 Start 575740.65 Finish 575746.75
AMD IPC is also similarly high.
Process Tree - phoronix/tjbench
Process Tree
The process tree is simple:
    7457) sh
      7458) tjbench
        7459) tjbench
          7460) tjbench
            7461) tjbench
          7462) tjbench
          7463) tjbench
            7464) tjbench
            7465) sed
          7466) tjbench
            7467) ls
            7468) sed
          7469) tjbench
          7470) tjbench
            7471) tjbench
            7472) sed
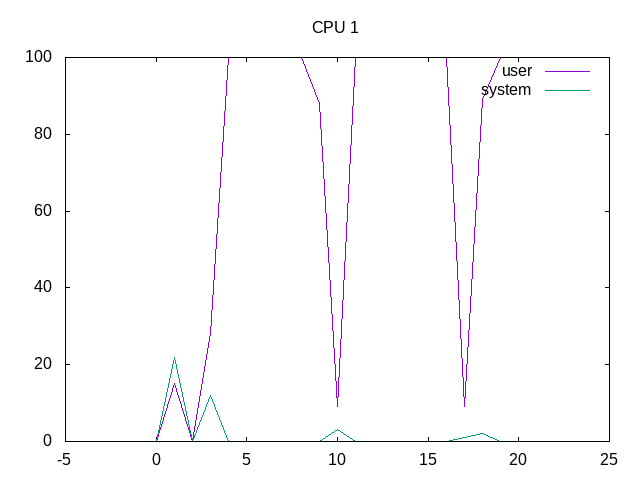
On_Core is 100%.
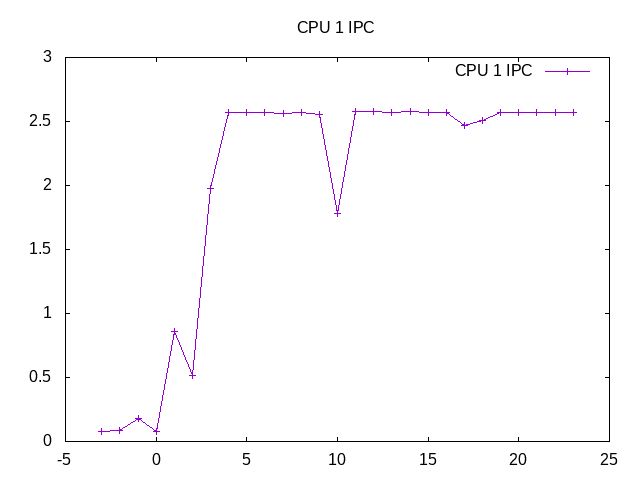
IPC is consistently high.
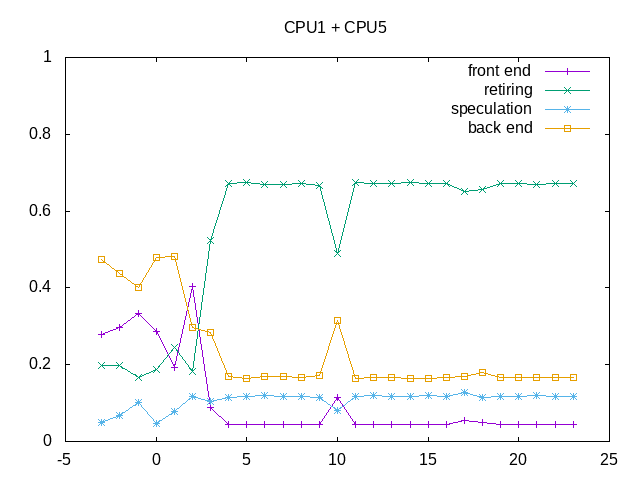
Bad speculation is higher than average.
on_cpu         0.103
elapsed        23.483
utime          18.953
stime          0.341
nvcsw          1041 (95.59%)
nivcsw         48 (4.41%)
inblock        0
onblock        696
retire         0.647
ms_uops                0.004
speculation    0.115
branch_misses          92.79%
machine_clears         7.21%
frontend       0.054
idq_uops_delivered_0   0.012
icache_stall               0.002
itlb_misses                0.001
idq_uops_delivered_1   0.016
idq_uops_delivered_2   0.029
idq_uops_delivered_3   0.053
dsb_ops                    82.93%
backend        0.184
resource_stalls.sb     0.003
stalls_ldm_pending     0.545
l2_refs                    0.003
l2_misses                  0.001
l2_miss_ratio              27.44%
l3_refs                    0.000
l3_misses                  0.000
l3_miss_ratio              18.53%
Speculation misses are mostly branch prediction related.
Next steps: None