
This is a test of ebizzy, a program to generate workloads resembling web server workloads.
The benchmark is also available at ebizzy.sourceforge.net. The code is a single C file with the following description.
/*
 * This program is designed to replicate a common web search app
 * workload.  A lot of search applications have the basic pattern: Get
 * a request to find a certain record, index into the chunk of memory
 * that contains it, copy it into another chunk, then look it up via
 * binary search.  The interesting parts of this workload are:
 *
 * Large working set
 * Data alloc/copy/free cycle
 * Unpredictable data access patterns
 *
 * Fiddle with the command line options until you get something
 * resembling the kind of workload you want to investigate.
 *
 */
Overall, I would describe this as more of a test of kernel memory management than end-user web server workloads.
Metrics (Intel) - phoronix/ebizzysh - pid 13863 On_CPU 0.999 On_Core 7.991 IPC 0.004 Retire 0.161 (16.1%) FrontEnd 0.121 (12.1%) Spec 0.001 (0.1%) Backend 0.717 (71.7%) Elapsed 20.01 Procs 19 Maxrss 15K Minflt 5699 Majflt 0 Inblock 0 Oublock 16 Msgsnd 0 Msgrcv 0 Nsignals 0 Nvcsw 404 (3.6%) Nivcsw 10679 Utime 159.872714 Stime 0.032662 Start 130135.09 Finish 130155.10
The code is on CPU almost 100% of the time. Most surprising is the very low IPC. As seen below, this is also present with perf.
perf stat ./ebizzy -S 20
166628 records/s
real 20.00 s
user 159.83 s
sys   0.01 s

 Performance counter stats for './ebizzy -S 20':

     159864.563702      task-clock (msec)         #    7.992 CPUs utilized
            10,749      context-switches          #    0.067 K/sec
               362      cpu-migrations            #    0.002 K/sec
             5,518      page-faults               #    0.035 K/sec
   558,145,095,782      cycles                    #    3.491 GHz
     2,264,406,709      instructions              #    0.00  insn per cycle
       548,534,010      branches                  #    3.431 M/sec
           744,373      branch-misses             #    0.14% of all branches

      20.003904689 seconds time elapsed
There seems to be a gap between instructions and topdown-slots-retired with almost 100x more slots retired than instructions. Are there instructions expanding out to a much larger set of uops to be retired on an Intel platform?
perf stat -e topdown-total-slots,topdown-slots-retired,instructions ./ebizzy -S 20
167680 records/s
real 20.00 s
user 159.81 s
sys   0.03 s

 Performance counter stats for './ebizzy -S 20':

 1,116,375,953,082      topdown-total-slots
   178,545,136,536      topdown-slots-retired     #     16.0% retiring
     2,254,519,938      instructions

      20.003326102 seconds time elapsed
Metrics (AMD) - phoronix/ebizzysh - pid 21303 On_CPU 0.998 On_Core 15.969 IPC 0.877 FrontCyc 0.003 (0.3%) BackCyc 0.042 (4.2%) Elapsed 20.05 Procs 35 Maxrss 23K Minflt 9866 Majflt 0 Inblock 0 Oublock 16 Msgsnd 0 Msgrcv 0 Nsignals 0 Nvcsw 1245 (3.7%) Nivcsw 31980 Utime 320.183905 Stime 0.000000 Start 140095.78 Finish 140115.83
Interestingly, AMD system does show instructions being retired.
Process Tree - phoronix/ebizzy
Process Tree
The process tree is straight forward.
    13111) sh elapsed=20.01 start=2.78 finish=22.79
      13112) ebizzy elapsed=20.01 start=2.78 finish=22.79
        13113) ebizzy elapsed=20.00 start=2.78 finish=22.78
        13114) ebizzy elapsed=20.00 start=2.78 finish=22.78
        13115) ebizzy elapsed=20.00 start=2.78 finish=22.78
        13116) ebizzy elapsed=20.00 start=2.78 finish=22.78
        13117) ebizzy elapsed=20.00 start=2.78 finish=22.78
        13118) ebizzy elapsed=20.00 start=2.78 finish=22.78
        13119) ebizzy elapsed=20.00 start=2.78 finish=22.78
        13120) ebizzy elapsed=20.00 start=2.78 finish=22.78
        13121) ebizzy elapsed=20.00 start=2.78 finish=22.78
        13122) ebizzy elapsed=20.00 start=2.78 finish=22.78
        13123) ebizzy elapsed=20.00 start=2.78 finish=22.78
        13124) ebizzy elapsed=20.00 start=2.78 finish=22.78
        13125) ebizzy elapsed=20.00 start=2.78 finish=22.78
        13126) ebizzy elapsed=20.00 start=2.78 finish=22.78
        13127) ebizzy elapsed=20.00 start=2.78 finish=22.78
        13128) ebizzy elapsed=20.00 start=2.78 finish=22.78
        13129) ebizzy elapsed=20.00 start=2.78 finish=22.78
 About this graph
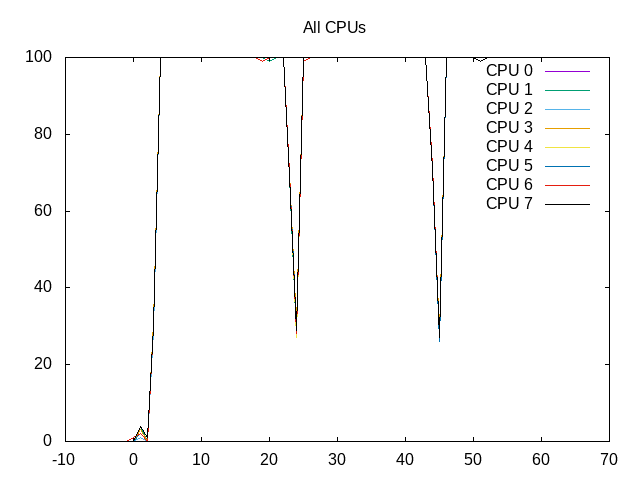
The core is kept busy almost 100% of the time.

Shows overall extremely low IPC.
 About this graph
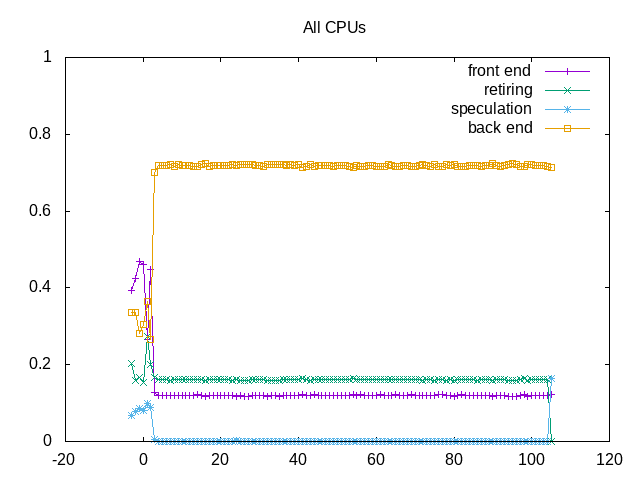
With more slots retired, this demonstrates the backend nature of this benchmark.
Next steps: Understand Intel implementation with just a few instructions becoming many more uops. Dig into backend stalls.