
This is a test of Indigo Renderer’s IndigoBench benchmark.
The benchmark runs through two workloads, running each instance three times for 60 seconds.
Metrics (Intel) - phoronix/indigobenchsh - pid 5023 On_CPU 0.974 On_Core 7.788 IPC 0.647 Retire 0.273 (27.3%) FrontEnd 0.194 (19.4%) Spec 0.196 (19.6%) Backend 0.337 (33.7%) Elapsed 62.41 Procs 40 Maxrss 1823K Minflt 700112 Majflt 0 Inblock 0 Oublock 32 Msgsnd 0 Msgrcv 0 Nsignals 0 Nvcsw 7351 (45.4%) Nivcsw 8824 Utime 485.150832 Stime 0.902968 Start 2446.39 Finish 2508.80
The benchmark is on the CPU close to 100%. The IPC is moderately low with backend memory stalls and bad speculation coming as limiters.
Metrics (AMD) - phoronix/indigobenchsh - pid 23002 On_CPU 0.971 On_Core 15.544 IPC 0.649 FrontCyc 0.059 (5.9%) BackCyc 0.038 (3.8%) Elapsed 62.06 Procs 72 Maxrss 1823K Minflt 703587 Majflt 0 Inblock 0 Oublock 32 Msgsnd 0 Msgrcv 0 Nsignals 0 Nvcsw 17443 (14.7%) Nivcsw 101239 Utime 963.500128 Stime 1.133917 Start 116590.61 Finish 116652.67
IPC on AMD is almost the same as Intel.
Process Tree - phoronix/indigobenchProcess Tree
   5023) sh
      5024) indigobench
        5025) indigo_benchmar
        5026) QXcbEventReader
        5027) indigo_benchmar
        5028) indigo_benchmar
        5029) indigo_benchmar
        5030) indigo_benchmar
        5031) indigo_benchmar
        5032) indigo_benchmar
        5033) indigo_benchmar
        5034) indigo_benchmar
        5035) Qt bearer threa
        5036) indigo_benchmar
        5037) indigo_benchmar
        5038) indigo_benchmar
        5039) indigo_benchmar
        5040) indigo_benchmar
        5041) indigo_benchmar
        5042) indigo_benchmar
        5043) indigo_benchmar
        5044) indigo_benchmar
        5045) indigo_benchmar
        5046) indigo_benchmar
        5047) indigo_benchmar
        5048) indigo_benchmar
        5049) indigo_benchmar
        5050) indigo_benchmar
        5051) indigo_benchmar
        5052) indigo_benchmar
        5053) indigo_benchmar
        5054) indigo_benchmar
        5055) indigo_benchmar
        5056) indigo_benchmar
        5057) indigo_benchmar
        5058) indigo_benchmar
        5060) indigo_benchmar
        5061) indigo_benchmar
        5062) indigo_benchmar
        5059) indigo_benchmar
The processtree is simple, running more processes than cores all running for 60 seconds.
 About this graph
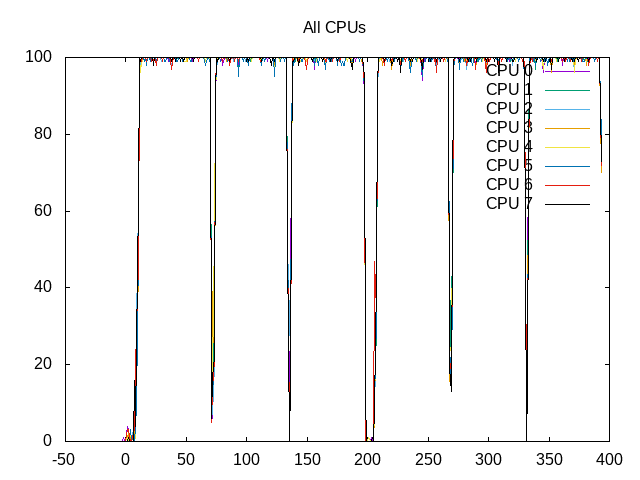
All cores running almost 100%.
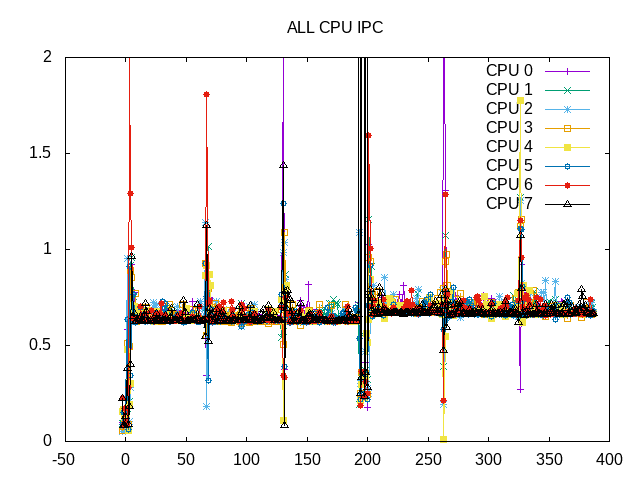
The IPC is also consistent with the second workload having just slightly higher IPC than the first.
 About this graph
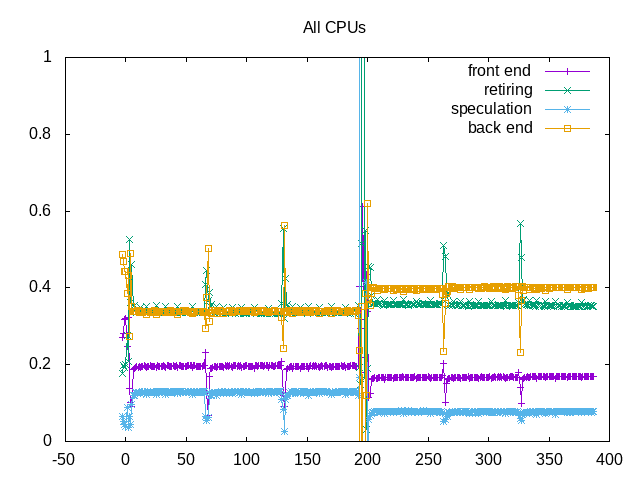
Backend stalls dominate the benchmark.
on_cpu         0.938
elapsed        387.657
utime          2903.724
stime          4.301
nvcsw          47310 (43.39%)
nivcsw         61717 (56.61%)
inblock        0
onblock        920
retire         0.352
ms_uops                0.007
speculation    0.102
branch_misses          93.71%
machine_clears         6.29%
frontend       0.181
idq_uops_delivered_0   0.061
icache_stall               0.020
itlb_misses                0.014
idq_uops_delivered_1   0.079
idq_uops_delivered_2   0.099
idq_uops_delivered_3   0.124
dsb_ops                    29.26%
backend        0.366
resource_stalls.sb     0.024
stalls_ldm_pending     0.425
l2_refs                    0.032
l2_misses                  0.008
l2_miss_ratio              25.04%
l3_refs                    0.007
l3_misses                  0.002
l3_miss_ratio              33.91%
Backend stalls are related to higher cache miss ratios for both L2 and L3. Bad speculation is mostly branch misprediction. The uop cache fills ~30% and neither icache nor itlb are large issues.