
Metrics (Intel) - phoronix/ttsiod-rendererA portable GPL 3D software renderer that supports OpenMP and Intel Threading Building Blocks with many different rendering modes. This version does not use OpenGL but is entirely CPU/software based.
sh - pid 7311
	On_CPU   0.975
	On_Core  7.797
	IPC      0.848
	Retire   0.499	(49.9%)
	FrontEnd 0.214	(21.4%)
	Spec     0.062	(6.2%)
	Backend  0.225	(22.5%)
	Elapsed  31.80
	Procs    10
	Minflt   8497
	Majflt   0
	Utime    247.81  	(100.0%)
	Stime    0.12    	(0.0%)
	Start    398896.60
	Finish   398928.40
The application runs for slightly over 30 seconds. The application is scheduled on the CPU just slightly less than 100% of the time. IPC is lower than some other benchmarks and suggests delays in backend are a factor.
Metrics (AMD) - phoronix/ttsiod-rendererttsiod-renderer - pid 4297 On_CPU 0.808 On_Core 12.930 IPC 1.053 FrontCyc 0.012 (1.2%) BackCyc 0.107 (10.7%) Elapsed 23.36 Procs 17 Minflt 8534 Majflt 0 Utime 300.94 (99.6%) Stime 1.11 (0.4%) Start 51139.78 Finish 51163.14
A case where the IPC on AMD is slightly higher than Intel.
Process Tree - phoronix/ttsiod-rendererProcess Tree
    7311) sh elapsed=31.80 start=0.00 finish=31.80
      7312) ttsiod-renderer elapsed=31.80 start=0.00 finish=31.80
        7313) renderer elapsed=31.80 start=0.00 finish=31.80
        7314) renderer elapsed=31.69 start=0.11 finish=31.80
        7315) renderer elapsed=31.69 start=0.11 finish=31.80
        7316) renderer elapsed=31.69 start=0.11 finish=31.80
        7317) renderer elapsed=31.69 start=0.11 finish=31.80
        7318) renderer elapsed=31.69 start=0.11 finish=31.80
        7319) renderer elapsed=31.69 start=0.11 finish=31.80
        7320) renderer elapsed=31.69 start=0.11 finish=31.80
The process tree is similar to others with parallel activities started on cores. One subtle difference is there are only seven children, not eight, a potential factor in why On_CPU isn’t quite 100%.
Resource metrics show some, but not abnormally high voluntary context switches (that would indicate processes waiting on resources), also a reasonable amount of blocks read in for a 30 second workload, so having a faster disk might help.
utime:    742.795869
stime:    0.371598
maxrss:   28K
minflt:   71799
majflt:   2
nswap:    0
inblock:  5880
oublock:  680
msgsnd:   0
msgrcv:   0
nsignals: 0
nvcsw:    31249
nivcsw:   5130
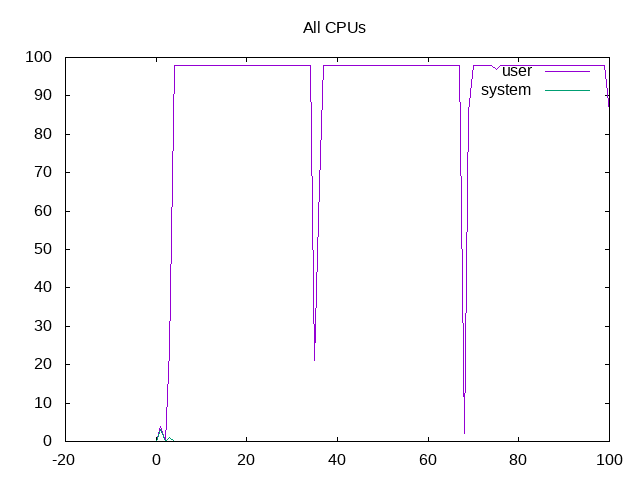
Add up the total usage of all CPUs and it looks evenly allocated just slightly less than 100%.
 About this graph
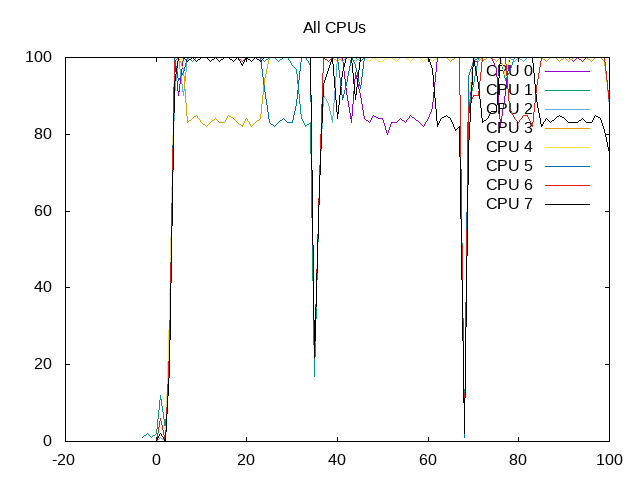
However, plot the cores separately and one sees how different cores become idle for short periods. This behavior is where I might expect the OS scheduler policy to have an effect.
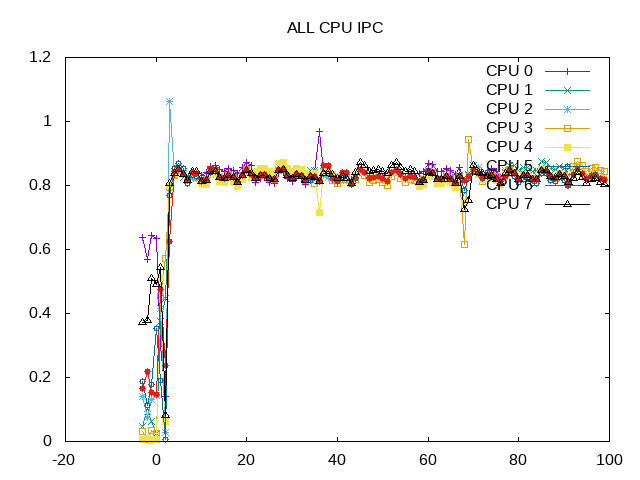
IPC across the three runs of the workload.
 About this graph
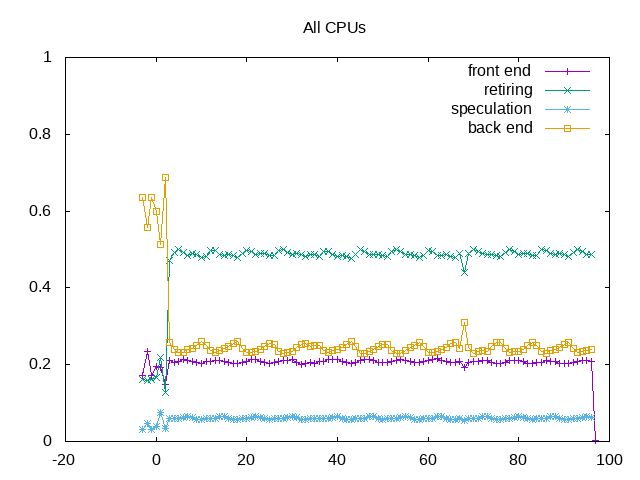
Backend stalls are slightly higher than average.
Next steps: Drill down on factors influencing backend stalls such as cache and memory.