
This test profile measures how long it takes to complete several reference GNU Octave files via octave-benchmark. GNU Octave is used for numerical computations and is an open-source alternative to MATLAB.
The benchmark runs six workloads in ~10 seconds. These tests are single-threaded and all testing was done pinned to core 1.
Description - phoronix/octave-benchmarksh - pid 17169 On_CPU 0.125 On_Core 0.999 IPC 1.555 Retire 0.323 (32.3%) FrontEnd 0.075 (7.5%) Spec 0.115 (11.5%) Backend 0.486 (48.6%) Elapsed 10.56 Procs 10 Maxrss 593K Minflt 1370931 Majflt 0 Inblock 0 Oublock 144 Msgsnd 0 Msgrcv 0 Nsignals 0 Nvcsw 104 (70.3%) Nivcsw 44 Utime 9.525428 Stime 1.029286 Start 65087.73 Finish 65098.29
The test is On_CPU almost 100%. The IPC is moderately high with backend stalls as the largest issue.
Metrics (AMD) - phoronix/octave-benchmarksh - pid 2530 On_CPU 0.062 On_Core 0.999 IPC 1.476 FrontCyc 0.076 (7.6%) BackCyc 0.162 (16.2%) Elapsed 9.89 Procs 10 Maxrss 594K Minflt 1370690 Majflt 0 Inblock 0 Oublock 104 Msgsnd 0 Msgrcv 0 Nsignals 0 Nvcsw 66 (6.3%) Nivcsw 982 Utime 8.835452 Stime 1.040407 Start 172659.53 Finish 172669.42
IPC on AMD is slightly lower.
Process Tree - phoronix/octave-benchmarkProcess Tree
    17169) sh
      17170) octave-benchmar
        17171) octave-cli
        17174) octave-cli
        17175) octave-cli
        17176) octave-cli
        17177) octave-cli
        17178) octave-cli
        17179) head
        17180) cut
The process tree is simple.

The workloads have some variation with the last workloads taking some system time and the first ones being predominately user time.
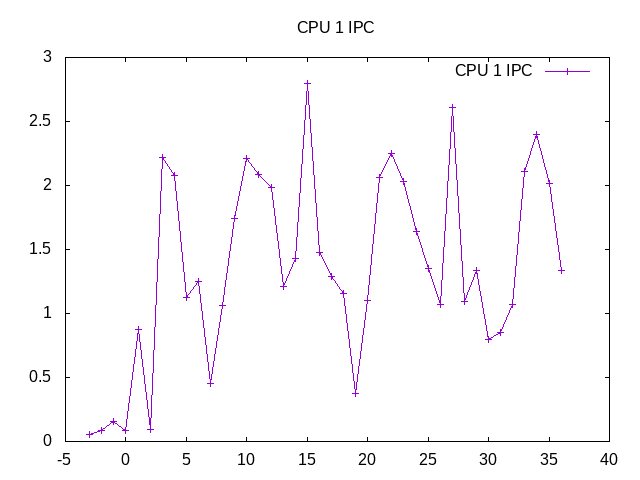
The IPC also varies some by workload. There is a one-second granularity of measurements, so not quite enough to sort out the six workloads from each other.

Topdown metrics show similar variations with occasional spikes in backend memory stalls and periods of speculative branch misses.
on_cpu         0.111
elapsed        37.064
utime          29.467
stime          3.397
nvcsw          1086 (89.98%)
nivcsw         121 (10.02%)
inblock        0
onblock        1192
retire         0.396
ms_uops                0.026
speculation    0.042
branch_misses          65.55%
machine_clears         34.45%
frontend       0.084
idq_uops_delivered_0   0.022
icache_stall               0.004
itlb_misses                0.002
idq_uops_delivered_1   0.034
idq_uops_delivered_2   0.047
idq_uops_delivered_3   0.062
dsb_ops                    65.39%
backend        0.479
resource_stalls.sb     0.069
stalls_ldm_pending     0.644
l2_refs                    0.032
l2_misses                  0.022
l2_miss_ratio              69.97%
l3_refs                    0.009
l3_misses                  0.003
l3_miss_ratio              37.13%
Surprisingly high cache miss rates on L2/L3. Approximately 2/3 of the uops come from the uop cache. Overall speculation is low.