
OpenFOAM is free computational fluid dynamics (CFD) software. The OpenFOAM website includes download links for prebuilt packages including this download link for ubuntu. I installed the same version on both AMD and Intel reference platforms.
There is a benchmark page that runs an OpenFOAM “motorbike” workload from a tutorial page with varying numbers of processes.
Below are results of running this benchmark on both Intel and AMD reference systems. A few items to note:
- A single-threaded run is slightly faster on my AMD system than Intel system
- The fastest instance on Intel is 4 threads on this 4-core/8-hyperthread system, i.e. no hyperthreading
- In contrast the fastest instance on AMD is 16 threads on this 8-core/16 hyperthread system, i.e. with hyperthreading. Not certain if this is different saturation points for the memory controllers or something that could benefit from better “pinning” discipline. Also interesting to see the On_CPU on Intel never get over 95%.
- One we get to optimal, further threads degrade performance rather than help, so optimal thread numbers are important for this workload and potentially others
| # of threads | Intel Wall Time | Speedup | IPC | On_CPU | AMD Wall Time | Speedup | IPC | On_CPU |
|---|---|---|---|---|---|---|---|---|
| 1 | 1520.487 | 1.0 | 1.402 | 12.5% | 1335.804 | 1.0 | 1.639 | 6.2% |
| 2 | 1041.154 | 1.5 | 1.255 | 24.9% | 885.919 | 1.5 | 1.563 | 12.4% |
| 4 | 661.560 | 2.3 * | 0.933 | 49.8% | 594.509 | 2.2 | 1.545 | 24.8% |
| 6 | 725.547 | 2.1 | 0.830 | 74.7% | 471.903 | 2.8 | 1.476 | 37.1% |
| 8 | 730.087 | 2.1 | 0.750 | 88.1% | 464.527 | 2.9 | 1.404 | 49.4% |
| 12 | 841.820 | 1.8 | 0.786 | 91.0% | 460.100 | 2.9 | 1.095 | 74.1% |
| 16 | 814.016 | 1.9 | 0.797 | 93.1% | 438.226 | 3.0 * | 0.876 | 98.4% |
| 20 | 949.668 | 1.6 | 0.794 | 94.1% | 536.027 | 2.5 | 0.934 | 99.1% |
| 24 | 1014.564 | 1.5 | 0.772 | 94.9% | 579.935 | 2.3 | 0.910 | 99.2% |
Metrics (Intel) - openfoam/motorbike
One script successively runs 1, 2, 4, 8, 12, 16, 20 and 24 as well as some post-processing. Below the metrics are broken out for several of these runs
Allmesh - pid 29947    // 1
	On_CPU   0.125
	On_Core  0.999
	IPC      1.402
	Retire   0.282	(28.2%)
	FrontEnd 0.025	(2.5%)
	Spec     0.108	(10.8%)
	Backend  0.585	(58.5%)
	Elapsed  1631.38
	Procs    8
	Maxrss   3689K
	Minflt   13927669
	Majflt   0
	Inblock  24
	Oublock  1651800
	Msgsnd   0
	Msgrcv   0
	Nsignals 0
	Nvcsw    61	(5.1%)
	Nivcsw   1138
	Utime    1617.801980
	Stime    12.369647
	Start    107834.21
	Finish   109465.59
Allmesh - pid 30130     // 4
	On_CPU   0.498
	On_Core  3.988
	IPC      0.933
	Retire   0.416	(41.6%)
	FrontEnd 0.188	(18.8%)
	Spec     0.188	(18.8%)
	Backend  0.208	(20.8%)
	Elapsed  905.33
	Procs    36
	Maxrss   1138K
	Minflt   7155228
	Majflt   21
	Inblock  16
	Oublock  1690016
	Msgsnd   0
	Msgrcv   0
	Nsignals 0
	Nvcsw    8491	(71.6%)
	Nivcsw   3365
	Utime    3598.138739
	Stime    12.178645
	Start    110563.46
	Finish   111468.79
Allmesh - pid 30304     // 8
	On_CPU   0.881
	On_Core  7.046
	IPC      0.750
	Retire   0.333	(33.3%)
	FrontEnd 0.200	(20.0%)
	Spec     0.147	(14.7%)
	Backend  0.320	(32.0%)
	Elapsed  922.39
	Procs    56
	Maxrss   802K
	Minflt   5365023
	Majflt   38
	Inblock  24
	Oublock  1724592
	Msgsnd   0
	Msgrcv   0
	Nsignals 0
	Nvcsw    15305	(0.1%)
	Nivcsw   25660292
	Utime    5160.536924
	Stime    1338.942608
	Start    112196.38
	Finish   113118.77
Allmesh - pid 30532
	On_CPU   0.931
	On_Core  7.446
	IPC      0.797
	Retire   0.336	(33.6%)
	FrontEnd 0.180	(18.0%)
	Spec     0.143	(14.3%)
	Backend  0.340	(34.0%)
	Elapsed  1031.02
	Procs    96
	Maxrss   718K
	Minflt   3186363
	Majflt   52
	Inblock  56
	Oublock  1810112
	Msgsnd   0
	Msgrcv   0
	Nsignals 0
	Nvcsw    27334	(0.0%)
	Nivcsw   308446440
	Utime    4362.069275
	Stime    3314.615273
	Start    114062.55
	Finish   115093.57
A few overall things to note: (a) the amount of system time is proportionally high, particularly when we have more than 4 threads. The amount of I/O blocks written or voluntary context switches suggest this isn’t I/O but perhaps some other forms of system contention e.g. shared memory? that likely starts limiting performance (b) the percentage of speculative misses are higher, though also different metric than I see with the overall “topdown” (c) otherwise backend and memory seems to dominate and limit.
Metrics (AMD) - openfoam/motorbikeAllmesh - pid 4196 // 1 On_CPU 0.062 On_Core 0.997 IPC 1.639 FrontCyc 0.000 (0.0%) BackCyc 0.000 (0.0%) Elapsed 1335.80 Procs 8 Maxrss 3669K Minflt 10685964 Majflt 6 Inblock 1960 Oublock 1651920 Msgsnd 0 Msgrcv 0 Nsignals 0 Nvcsw 73 (0.1%) Nivcsw 130138 Utime 1323.922851 Stime 8.315829 Start 6978.13 Finish 8313.93 Allmesh - pid 4291 // 4 On_CPU 0.248 On_Core 3.967 IPC 1.545 FrontCyc 0.000 (0.0%) BackCyc 0.000 (0.0%) Elapsed 594.51 Procs 36 Maxrss 1138K Minflt 6792141 Majflt 23 Inblock 144 Oublock 1689152 Msgsnd 0 Msgrcv 0 Nsignals 0 Nvcsw 7921 (3.3%) Nivcsw 229242 Utime 2346.044338 Stime 12.437106 Start 9199.87 Finish 9794.38 Allmesh - pid 4425 // 8 On_CPU 0.494 On_Core 7.907 IPC 1.404 FrontCyc 0.000 (0.0%) BackCyc 0.000 (0.0%) Elapsed 464.53 Procs 56 Maxrss 780K Minflt 5773120 Majflt 47 Inblock 544 Oublock 1713440 Msgsnd 0 Msgrcv 0 Nsignals 0 Nvcsw 12114 (3.3%) Nivcsw 354717 Utime 3650.304180 Stime 22.769123 Start 10266.36 Finish 10730.89 Allmesh - pid 4571 // 16 On_CPU 0.984 On_Core 15.750 IPC 0.876 FrontCyc 0.000 (0.0%) BackCyc 0.000 (0.0%) Elapsed 438.22 Procs 96 Maxrss 720K Minflt 2985604 Majflt 79 Inblock 536 Oublock 1775192 Msgsnd 0 Msgrcv 0 Nsignals 0 Nvcsw 22650 (3.1%) Nivcsw 700796 Utime 5656.053236 Stime 1245.739203 Start 11191.02 Finish 11629.24
AMD shows a similar jump in system time once we go over the 8 physical cores. IPC might not be the best metric here since it seems at some point we’re limited by backend memory stalls. However, the IPC on AMD is consistently higher than the Intel system.
Using “perf record” to look at where the time is spent and then looking at the kernel symbols
     5.15%  simpleFoam  [kernel.kallsyms]                     [.] syscall_return_via_sysret
     1.95%  simpleFoam  [kernel.kallsyms]                     [k] __schedule
     1.73%  simpleFoam  [kernel.kallsyms]                     [k] copy_pte_range
     1.70%  simpleFoam  [kernel.kallsyms]                     [k] update_curr
     1.52%  simpleFoam  [kernel.kallsyms]                     [k] pick_next_task_fair
     1.45%  simpleFoam  [kernel.kallsyms]                     [k] unmap_page_range
     1.09%  simpleFoam  [kernel.kallsyms]                     [k] do_syscall_64
     1.03%  simpleFoam  [kernel.kallsyms]                     [k] entry_SYSCALL_64_after_hwframe
     0.85%  simpleFoam  [kernel.kallsyms]                     [k] __calc_delta
     0.82%  simpleFoam  [kernel.kallsyms]                     [k] pick_next_entity
     0.70%  simpleFoam  [kernel.kallsyms]                     [k] yield_task_fair
     0.63%  simpleFoam  [kernel.kallsyms]                     [k] _raw_spin_lock
     0.59%  simpleFoam  [kernel.kallsyms]                     [k] sys_sched_yield
     0.52%  simpleFoam  [kernel.kallsyms]                     [k] update_min_vruntime
     0.46%  simpleFoam  [kernel.kallsyms]                     [k] native_sched_clock
     0.44%  simpleFoam  [kernel.kallsyms]                     [k] clear_page_erms
     0.43%  simpleFoam  [kernel.kallsyms]                     [k] rcu_note_context_switch
     0.39%  simpleFoam  [kernel.kallsyms]                     [k] free_pages_and_swap_cache
     0.36%  simpleFoam  [kernel.kallsyms]                     [k] entry_SYSCALL_64_stage2
     0.36%  simpleFoam  [kernel.kallsyms]                     [k] release_pages
     0.34%  simpleFoam  [kernel.kallsyms]                     [k] update_rq_clock
     0.34%  simpleFoam  [kernel.kallsyms]                     [k] __indirect_thunk_start
     0.33%  simpleFoam  [kernel.kallsyms]                     [k] cpuacct_charge
     0.32%  simpleFoam  [kernel.kallsyms]                     [k] __cgroup_account_cputime
     0.30%  simpleFoam  [kernel.kallsyms]                     [k] schedule
     0.28%  simpleFoam  [kernel.kallsyms]                     [k] copy_user_enhanced_fast_string
     0.27%  simpleFoam  [kernel.kallsyms]                     [k] cgroup_cpu_stat_updated
     0.26%  simpleFoam  [kernel.kallsyms]                     [k] page_remove_rmap
     0.25%  simpleFoam  [kernel.kallsyms]                     [k] _vm_normal_page
     0.25%  simpleFoam  [kernel.kallsyms]                     [k] clear_buddies
     0.23%  simpleFoam  [kernel.kallsyms]                     [k] get_page_from_freelist
     0.23%  simpleFoam  [kernel.kallsyms]                     [k] check_cfs_rq_runtime
     0.22%  simpleFoam  [kernel.kallsyms]                     [.] native_irq_return_iret
     0.20%  addr2line   [kernel.kallsyms]                     [k] copy_user_enhanced_fast_string
     0.17%  simpleFoam  [kernel.kallsyms]                     [k] native_queued_spin_lock_slowpath
     0.17%  simpleFoam  [kernel.kallsyms]                     [k] sched_clock_cpu
     0.16%  simpleFoam  [kernel.kallsyms]                     [k] swapgs_restore_regs_and_return_to_usermode
     0.16%  simpleFoam  [kernel.kallsyms]                     [k] error_entry
     0.13%  simpleFoam  [kernel.kallsyms]                     [k] __switch_to
     0.13%  simpleFoam  [kernel.kallsyms]                     [k] handle_pte_fault
     0.13%  simpleFoam  [kernel.kallsyms]                     [k] sched_clock
     0.11%  addr2line   [kernel.kallsyms]                     [k] clear_page_erms
     0.10%  simpleFoam  [kernel.kallsyms]                     [k] __handle_mm_fault
     0.10%  simpleFoam  [kernel.kallsyms]                     [k] free_pcppages_bulk
Looking at the routines with over 0.10% of the time, seems like memory management and process scheduling come highest on the list with some time also spent in syscalls. I wonder if the overall virtual memory size limits are introducing issues here.
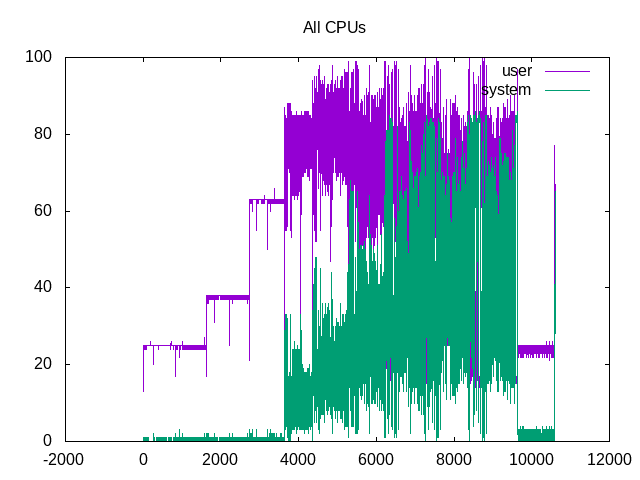
The sum of time scheduled for all cores, shows the 1, 2 and 4 having minimal system time and overall scheduled almost 12.5%, 25.0% and 50.0% respectively. After this, system time climbs and the overall scheduling also seems more volatile. The post-process time at the end is also more well-behaved and looks like it is mostly single-threaded. Breaking this out by individual core usage doesn’t help much because of the extra noise.
Process Tree - openfoam/motorbike
Process Tree
The process tree is a bit more complex, below are the processes run in a 4-core version
  30130) Allmesh
    30131) cp
    30132) surfaceFeatureE
    30133) blockMesh
    30134) decomposePar
    30135) Allmesh
      30136) foamDictionary
    30137) mpirun
      30142) snappyHexMesh
      30143) snappyHexMesh
      30144) snappyHexMesh
      30145) snappyHexMesh
      30146) snappyHexMesh
      30147) snappyHexMesh
      30148) snappyHexMesh
      30149) snappyHexMesh
      30150) snappyHexMesh
      30151) snappyHexMesh
      30152) snappyHexMesh
      30153) snappyHexMesh
    30138) mpirun
    30139) mpirun
    30140) mpirun
    30141) mpirun
    30186) ls
    30187) xargs
      30188) rm
      30189) rm
      30190) rm
      30191) rm
    30192) ls
    30193) xargs
      30194) cp
      30195) cp
      30196) cp
      30197) cp
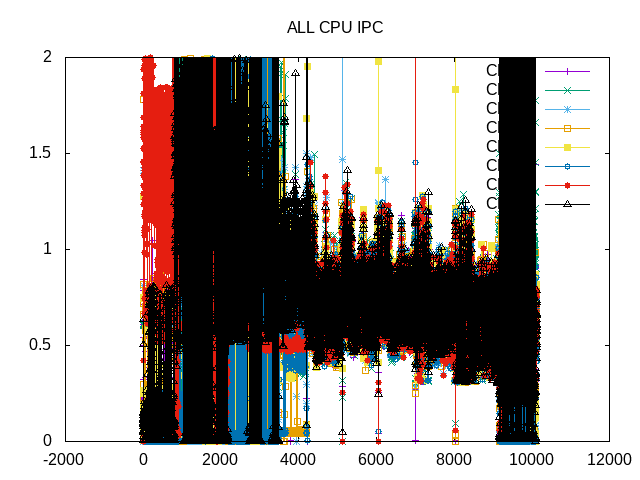
The IPC reflects some noise in different sections of the code, even with low numbers of threads.
 About this graph
The noise is also reflected in the topdown metrics graph. However, overall dominance of backend memory stalls is still apparent.
on_cpu         0.605
elapsed        10183.010
utime          39507.432
stime          9782.333
nvcsw          289898 (0.00%)
nivcsw         7970072700 (100.00%)
inblock        544
onblock        16475720
retire         0.366
ms_uops                0.071
speculation    0.069
branch_misses          42.21%
machine_clears         57.79%
frontend       0.184
idq_uops_delivered_0   0.057
icache_stall               0.003
itlb_misses                0.011
idq_uops_delivered_1   0.079
idq_uops_delivered_2   0.104
idq_uops_delivered_3   0.129
dsb_ops                    51.69%
backend        0.381
resource_stalls.sb     0.016
stalls_ldm_pending     0.409
l2_refs                    0.012
l2_misses                  0.005
l2_miss_ratio              39.16%
l3_refs                    0.003
l3_misses                  0.001
l3_miss_ratio              52.26%
These metrics are for the entire run of two and a half hours and as seen above the workloads differ some particularly for more than 4 threads. However, overall shows a lower level of speculation with some machine clears contributing more than branch misses. It also shows a high rate of iTLB misses suggesting a large working set size. Approximately half the uops come from the uop cache. Otherwise, the backend stalls are high with high cache-miss ratios.