
This is a standard video encoding performance test of Google’s libvpx library and the vpxenc command for the VP8/WebM format.
The test runs ./vpxenc with particular options on an image file. On both my 8-core Intel and 16-core AMD, this seems to run four processes in parallel.
Metrics (Intel) - phoronix/vpxencOn_CPU 0.329 On_Core 2.636 IPC 2.024 Retire 0.431 (43.1%) FrontEnd 0.111 (11.1%) Spec 0.158 (15.8%) Backend 0.299 (29.9%) Elapsed 259.33 Procs 6 Maxrss 289K Minflt 112781 Majflt 0 Inblock 0 Oublock 264 Msgsnd 0 Msgrcv 0 Nsignals 0 Nvcsw 151733 (99.5%) Nivcsw 755 Utime 681.510345 Stime 2.034847 Start 100816.48 Finish 101075.81
The On_CPU is only 33%, so in addition to running only four threads, these are only kept busy on average 2/3 of the time. The percentage of voluntary context switches is ~99.5% of the total, so four threads with short bursts switching back and forth for short periods of time. Otherwise the IPC is moderately high with backend stalls being the largest issue.
Metrics (AMD) - phoronix/vpxencsh - pid 27234 On_CPU 0.168 On_Core 2.692 IPC 2.037 FrontCyc 0.000 (0.0%) BackCyc 0.000 (0.0%) Elapsed 278.21 Procs 6 Maxrss 289K Minflt 112784 Majflt 0 Inblock 0 Oublock 264 Msgsnd 0 Msgrcv 0 Nsignals 0 Nvcsw 274866 (80.9%) Nivcsw 65034 Utime 747.130561 Stime 1.723176 Start 604864.48 Finish 605142.69
AMD metrics show an even lower On_CPU with only 4 threads running. Otherwise the IPC is similar.
Process Tree - phoronix/vpxenc
Process Tree
The process tree is simple.
    25670) sh
      25671) vpxenc
        25672) vpxenc
        25676) vpxenc
        25677) vpxenc
        25678) vpxenc

This results in a somewhat chaotic total of time spent scheduled.
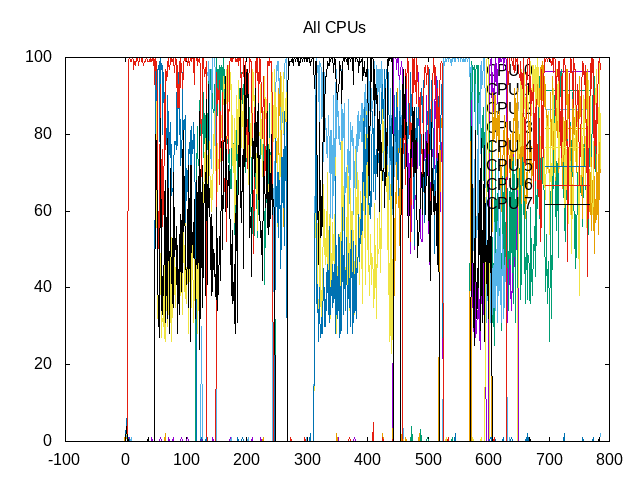 About this graph
Even more chaotic if you look at individual threads.
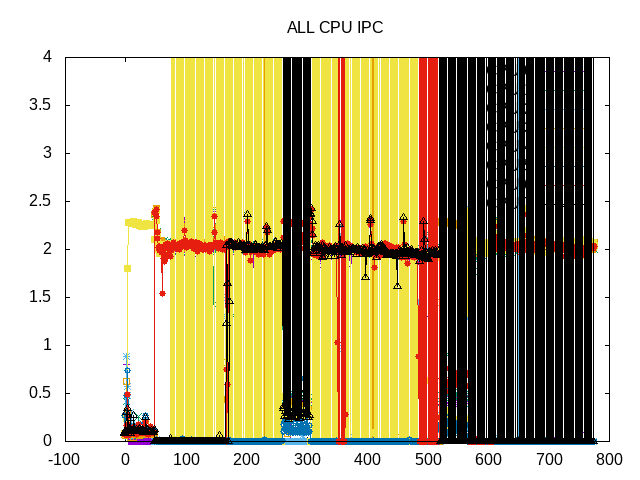
These chaotic threads make the IPC tough to discern.
 About this graph
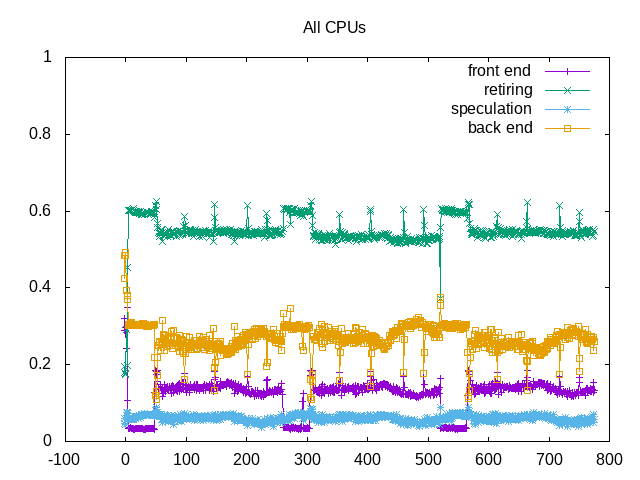
However, the topdown metrics are more stable.
on_cpu         0.327
elapsed        779.596
utime          2033.577
stime          3.602
nvcsw          453038 (99.58%)
nivcsw         1898 (0.42%)
inblock        0
onblock        1456
retire         0.542
ms_uops                0.006
speculation    0.060
branch_misses          90.45%
machine_clears         9.55%
frontend       0.130
idq_uops_delivered_0   0.030
icache_stall               0.014
itlb_misses                0.000
idq_uops_delivered_1   0.046
idq_uops_delivered_2   0.070
idq_uops_delivered_3   0.113
dsb_ops                    47.71%
backend        0.268
resource_stalls.sb     0.015
stalls_ldm_pending     0.560
l2_refs                    0.030
l2_misses                  0.011
l2_miss_ratio              37.14%
l3_refs                    0.010
l3_misses                  0.001
l3_miss_ratio              7.44%
The overall topdown metrics show the context switches, not many block of I/O, and backend stalls with miss ratios of 37% from L2 and 7% from L3. I expect performance might improve slightly with better thread pinning.