
Metrics (Intel) - phoronix/primesievePrimesieve generates prime numbers using a highly optimized sieve of Eratosthenes implementation. Primesieve benchmarks the CPU’s L1/L2 cache performance.
sh - pid 13547
	On_CPU   0.998
	On_Core  7.982
	IPC      0.688
	Retire   0.373	(37.3%)
	FrontEnd 0.137	(13.7%)
	Spec     0.173	(17.3%)
	Backend  0.317	(31.7%)
	Elapsed  83.16
	Procs    11
	Maxrss   45K
	Minflt   20280
	Majflt   0
	Inblock  0
	Oublock  16
	Msgsnd   0
	Msgrcv   0
	Nsignals 0
	Nvcsw    192	(5.0%)
	Nivcsw   3671
	Utime    663.706994
	Stime    0.058072
	Start    85394.72
	Finish   85477.88
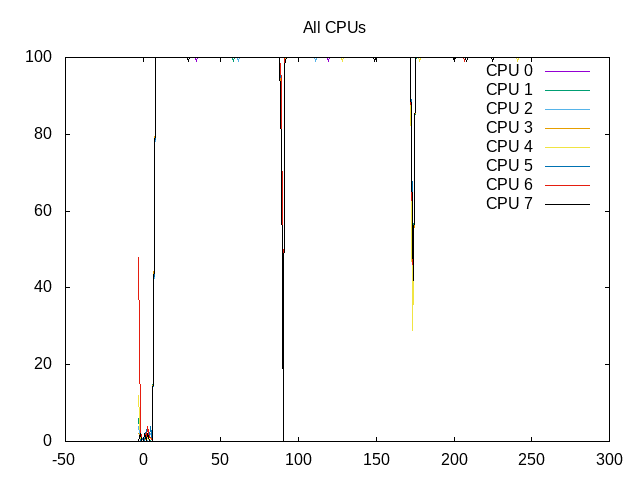
The code is On_CPU almost 100%. There are a fair number of backend stalls, also reflecting the “test of cache performance” note in the description. Also a moderate amount of speculative misses.
Metrics (AMD) - phoronix/primesievesh - pid 28397 On_CPU 0.994 On_Core 15.911 IPC 0.788 FrontCyc 0.000 (0.0%) BackCyc 0.000 (0.0%) Elapsed 37.81 Procs 19 Maxrss 24K Minflt 9960 Majflt 0 Inblock 0 Oublock 16 Msgsnd 0 Msgrcv 0 Nsignals 0 Nvcsw 657 (1.1%) Nivcsw 60232 Utime 601.568254 Stime 0.043967 Start 956973.83 Finish 957011.64
IPC on AMD is just slightly higher.
 About this graph
CPU cores are kept scheduled at 100%.
Process Tree - phoronix/primesieve
Process Tree
The process tree is simple.
    13547) sh
      13548) primesieve-test
        13549) primesieve
        13550) primesieve
        13551) primesieve
        13552) primesieve
        13553) primesieve
        13554) primesieve
        13555) primesieve
        13556) primesieve
        13557) primesieve
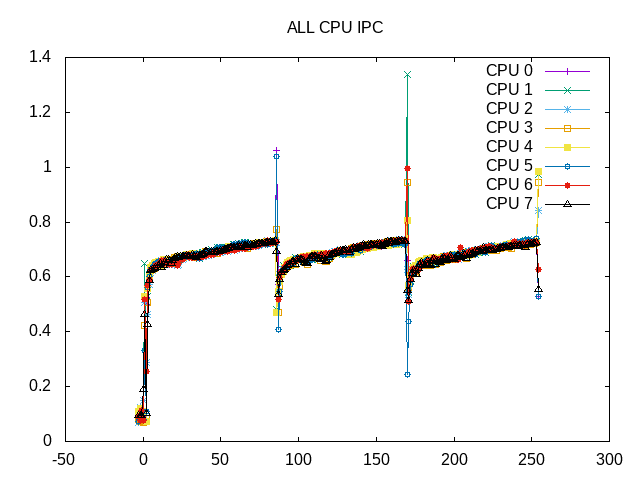
IPC is mostly steady, but rising slowly in the test.
 About this graph
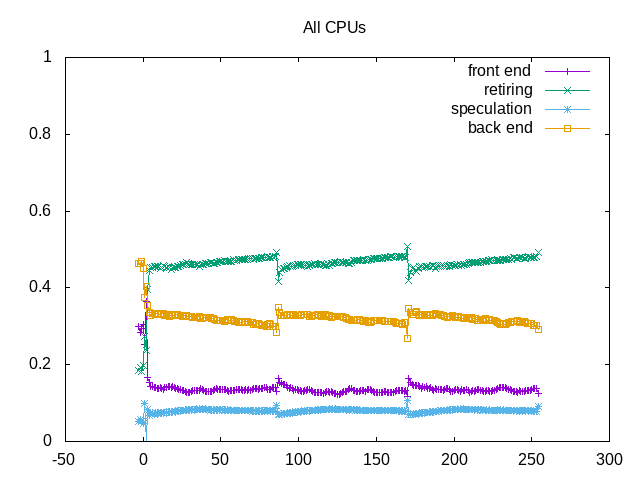
The ride in IPC also corresponds to fewer backend stalls.
on_cpu         0.978
elapsed        254.425
utime          1991.035
stime          0.359
nvcsw          1537 (11.42%)
nivcsw         11920 (88.58%)
inblock        0
onblock        728
retire         0.465
ms_uops                0.001
speculation    0.080
branch_misses          97.61%
machine_clears         2.39%
frontend       0.135
idq_uops_delivered_0   0.036
icache_stall               0.000
itlb_misses                0.000
idq_uops_delivered_1   0.046
idq_uops_delivered_2   0.049
idq_uops_delivered_3   0.139
dsb_ops                    70.41%
backend        0.320
resource_stalls.sb     0.170
stalls_ldm_pending     0.323
l2_refs                    0.093
l2_misses                  0.013
l2_miss_ratio              14.18%
l3_refs                    0.012
l3_misses                  0.000
l3_miss_ratio              1.21%
L2 miss ratio of 14% and L3 of 1.2% likely help drive the backend stalls. The frontend stalls appear to be more through packing. Around 70% of these come from the uop cache. Bad speculation is branch misses.