
This is a test to obtain the general Numpy performance.
This test goes many different python2 examples and then reports an average time. These subtests run of varying length. Following is example output
reverse_cumsum Python 2410 2466 38
diffusion Python 21340 21383 43
mandel Python 297265 302523 4935
local_maxima Python 31333 31447 123
fft Python 9103 9297 100
fdtd Python 725573 731770 4118
rosen Python 10088 10182 54
evolve Python 1631 1710 38
cronbach Python 829 845 10
grayscott Python 37203 37440 142
wave Python 27278 27832 749
vibr_energy Python 1479 1490 17
julia Python 771131 786176 16515
growcut Python 705226 714857 11488
periodic_dist Python 872 877 7
repeating Python 949 961 11
multiple_sum Python 1598 1609 18
wdist Python 28934 29183 145
hyantes Python 107016 112128 5632
allpairs_distances Python 14829 15087 601
arc_distance Python 971 976 4
harris Python 3718 3760 29
smoothing Python 325344 327078 1047
l2norm Python 1806 1836 27
hasting Python 3 3 0
allpairs_distances_loops Python 16262 16326 77
create_grid Python 3383 3408 37
pairwise Python 1310533 1312147 1503
slowparts Python 2187 2194 7
grouping Python 1621 1683 33
conv Python 1008397 1008954 540
lstsqr Python 5261 5279 18
specialconvolve Python 4242 4269 20
What gets printed is the sum of the average times (last column), so a mix of some long-running processes with very short ones.
The test is single-threaded and all testing was done bound to core 1.
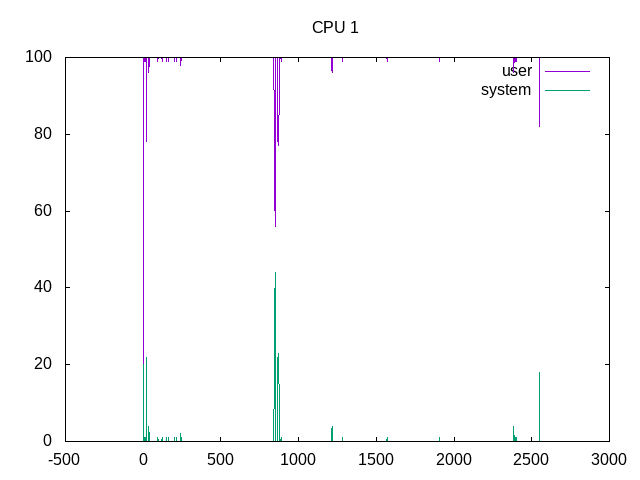
Metrics (Intel) - phoronix/numpysh - pid 17444 On_CPU 0.125 On_Core 1.000 IPC 2.430 Retire 0.500 (50.0%) FrontEnd 0.277 (27.7%) Spec 0.154 (15.4%) Backend 0.069 (6.9%) Elapsed 2566.96 Procs 39 Maxrss 52K Minflt 7526820 Majflt 0 Inblock 0 Oublock 648 Msgsnd 0 Msgrcv 0 Nsignals 0 Nvcsw 274 (19.7%) Nivcsw 1114 Utime 2561.043313 Stime 5.910712 Start 142662.17 Finish 145229.13
The code is On_Core 100%. There are some frontend stalls, but overall a medium IPC.
Process Tree - phoronix/numpy
Process Tree
The process tree is simple as it goes through each workload.
    17444) sh
      17445) numpy
        17446) run.sh
          17447) dirname
          17448) python2
          17454) python2
          17455) python2
          17456) python2
          17457) python2
          17458) python2
          17459) python2
          17468) python2
          17469) python2
          17470) python2
          17471) python2
          17472) python2
          17473) python2
          17474) python2
          17475) python2
          17476) python2
          17477) python2
          17478) python2
          17480) python2
          17481) python2
          17482) python2
          17486) python2
          17487) python2
          17524) python2
          17525) python2
          17526) python2
          17527) python2
          17533) python2
          17534) python2
          17548) python2
          17549) python2
          17551) python2
          17554) python2
        17555) cat
        17556) awk
Metrics (AMD) - phoronix/numpysh - pid 5298 On_CPU 0.062 On_Core 1.000 IPC 1.897 FrontCyc 0.093 (9.3%) BackCyc 0.268 (26.8%) Elapsed 3423.38 Procs 39 Maxrss 51K Minflt 7543159 Majflt 0 Inblock 0 Oublock 664 Msgsnd 0 Msgrcv 0 Nsignals 0 Nvcsw 274 (0.1%) Nivcsw 320371 Utime 3417.064884 Stime 5.136417 Start 19908.09 Finish 23331.47
AMD IPC just a bit lower.
Scheduled 100% of the time.
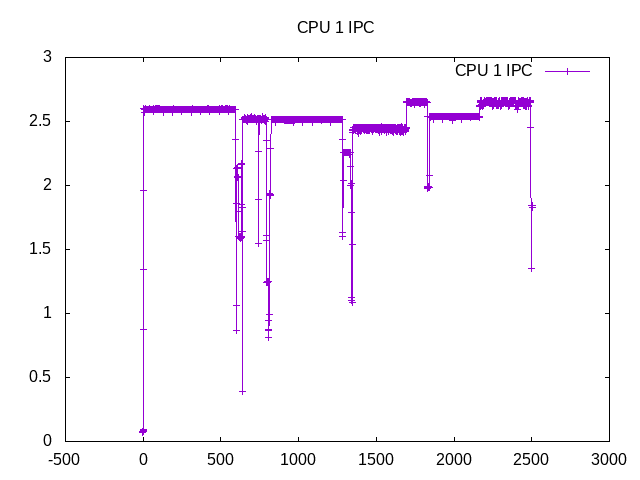
Slight variations in IPC amongst workloads.
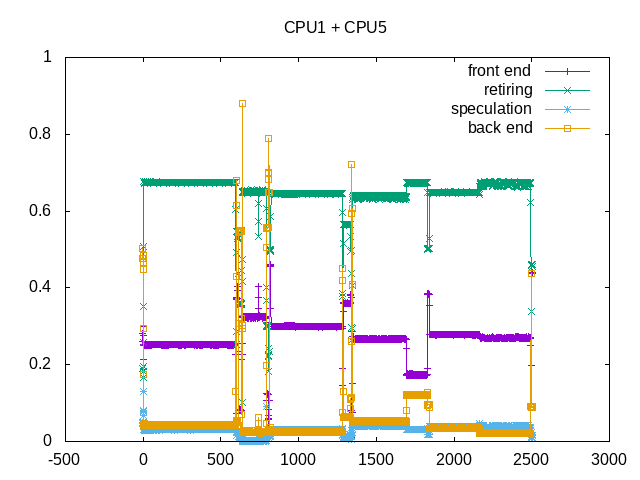
Frontend stalls are the largest issue.
on_cpu         0.125
elapsed        2490.642
utime          2481.306
stime          2481.306
nvcsw          967 (36.59%)
nivcsw         1676 (63.41%)
inblock        0
inblock        1240
retire         0.645
ms_uops                0.005
speculation    0.031
branch_misses          38.82%
machine_clears         61.18%
frontend       0.261
idq_uops_delivered_0   0.036
icache_stall               0.003
itlb_misses                0.001
idq_uops_delivered_1   0.093
idq_uops_delivered_2   0.158
idq_uops_delivered_3   0.235
dsb_ops                    50.94%
backend        0.063
resource_stalls.sb     0.005
stalls_ldm_pending     0.520
l2_refs                    0.006
l2_misses                  0.001
l2_miss_ratio              18.50%
l3_refs                    0.000
l3_misses                  0.000
l3_miss_ratio              8.84%
Frontend limited, though not necessarily icache or itlb (branch resteers or inefficient uop generation?).
Next steps: Understand why AMD IPC is lower.