
Metrics (Intel) - phoronix/hmmerThis test searches through the Pfam database of profile hidden markov models. The search finds the domain structure of Drosophila Sevenless protein.
sh - pid 31393
	On_CPU   0.893
	On_Core  7.144
	IPC      1.295
	Retire   0.703	(70.3%)
	FrontEnd 0.101	(10.1%)
	Spec     0.030	(3.0%)
	Backend  0.166	(16.6%)
	Elapsed   9.75
	Procs    12
	Maxrss   254K
	Minflt   73985
	Majflt   0
	Inblock  0
	Oublock  8
	Msgsnd   0
	Msgrcv   0
	Nsignals 0
	Nvcsw    4869	(90.8%)
	Nivcsw   494
	Utime    69.220512
	Stime    0.436867
	Start    520469.51
	Finish   520479.26
The On_CPU is ~90% and it has a large number of voluntary context switches (90%). While the amount of I/O blocks recorded isn’t large, this benchmark has characteristics of one that waits on either I/O or other external item and hence may have limitations to scaling. The IPC of 1.30 and relatively high retirement rate put this middle of range with some backend stalls and some front end stalls.
Metrics (AMD) - phoronix/hmmersh - pid 17723 On_CPU 0.538 On_Core 8.604 IPC 1.503 FrontCyc 0.136 (13.6%) BackCyc 0.101 (10.1%) Elapsed 8.53 Procs 20 Maxrss 490K Minflt 133420 Majflt 0 Inblock 0 Oublock 8 Msgsnd 0 Msgrcv 0 Nsignals 0 Nvcsw 7886 (52.5%) Nivcsw 7132 Utime 72.693009 Stime 0.702369 Start 530601.54 Finish 530610.07
AMD platform shows a dropping of On_CPU as number of cores goes up correlating to scaling issues. The IPC when running is higher for AMD than Intel.
Process Tree - phoronix/hmmerProcess Tree
   31393) sh
      31394) hmmer
        31395) hmmpfam
          31396) hmmpfam
          31397) hmmpfam
          31398) hmmpfam
          31399) hmmpfam
          31400) hmmpfam
          31401) hmmpfam
          31402) hmmpfam
          31403) hmmpfam
          31404) hmmpfam
The process tree is simple.
 About this graph
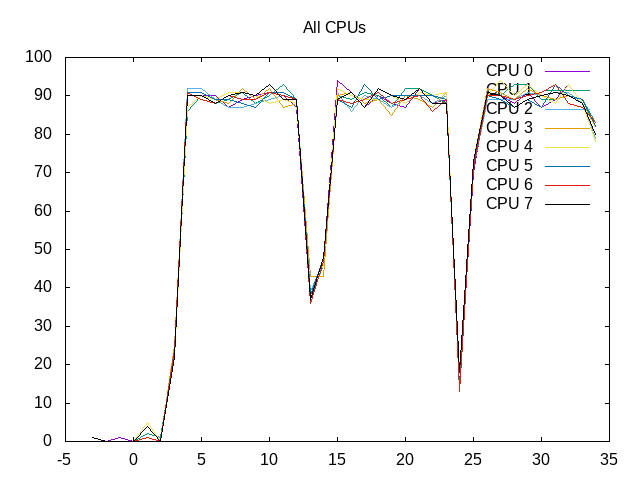
All the cores are kept consistently busy though at ~90%.
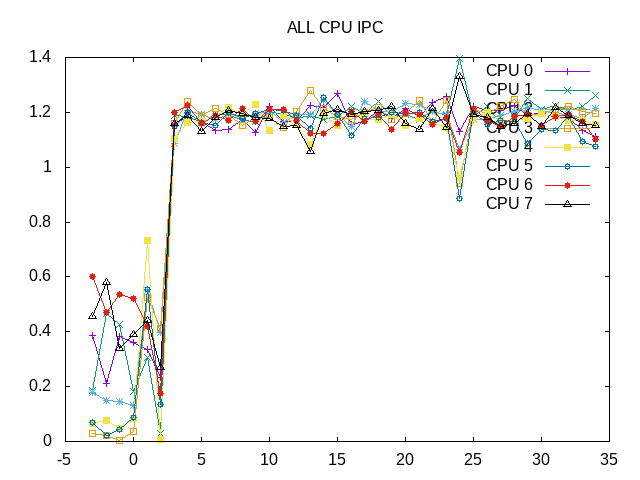
The IPC is also fairly consistent.
 About this graph
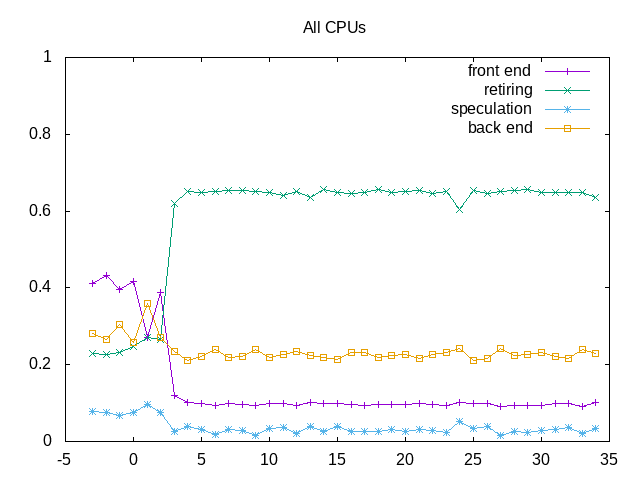
Shows ~15% of time in backend stalls and ~10% in frontend stalls.
Next steps: None