
This test times how long it takes to build the Linux kernel.
In particular, the test does a “make” against sources for the Linux 4.13 kernel.
Metrics (Intel) - phoronix/build-linux-kernel
sh - pid 30550
	On_CPU   0.875
	On_Core  6.996
	IPC      0.728
	Retire   0.362	(36.2%)
	FrontEnd 0.431	(43.1%)
	Spec     0.114	(11.4%)
	Backend  0.094	(9.4%)
	Elapsed  160.12
	Procs    29135
	Minflt   31486712
	Majflt   1
	Utime    1078.81 	(96.3%)
	Stime    41.44   	(3.7%)
	Start    403802.45
	Finish   403962.57
Several things to observe from the overall metrics:
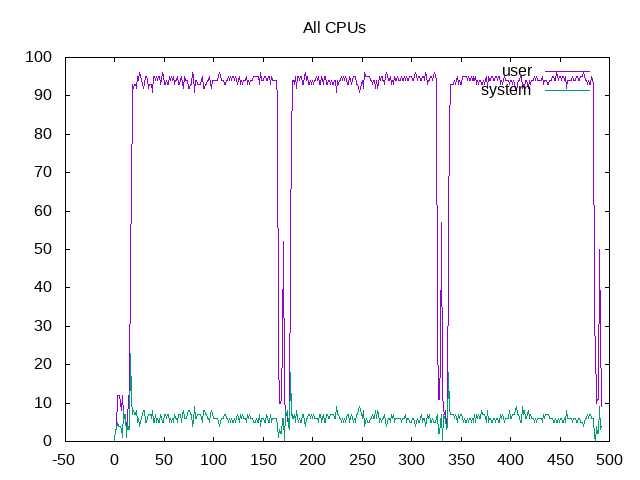
- On my system, the workload is ~87.5% On_CPU. For a build application like this, there are two likely sources for time not on the CPU: (1) parts of the built that are not parallel. If this were the case, plotting the On_CPU metric over time might have periods of high spots e.g. parallel compiles and low spots e.g. serialized link steps. Examination of the workload and the plot below say this is not the case. This is in contrast to a workload like build-gcc and (2) time spent in I/O such as reading/writing to the disk. The resource stats below will give additional clues.
- This workload has a higher percentage of frontend stalls as compared to other workloads. This suggests deeper investigations into icaches, TLBs, etc are likely a factor for lower IPC. A slightly high bad speculation is also a potential factor for a somewhat lower IPC.
time-compile-ke - pid 714
	On_CPU   0.809
	On_Core  12.940
	IPC      0.708
	FrontCyc 0.110	(11.0%)
	BackCyc  0.109	(10.9%)
	Elapsed  98.12
	Procs    29143
	Minflt   31542640
	Majflt   1
	Utime    1212.23 	(95.5%)
	Stime    57.45   	(4.5%)
	Start    55562.70
	Finish   55660.82
Comparing the metrics with my AMD system, the On_CPU percentage is slightly lower. This reflects the parallel in-core aspects becoming less dominant than either non-parallel parts of the application or disk I/O; i.e. compiles speed up and disk I/O and parallel link becomes a larger proportion.
The number of processes in these builds is just slightly different between AMD/Intel runs (29135 vs. 29143) but not sure if I might have missed a few in the tool or the environment causes slightly different builds to happen. More significant on both platforms is when the benchmark runs the workload three times, the number of processes is a fair amount higher in the first run as the second and third:
benchmark run #1 has 29135 processes
benchmark run #2 has 26129 processes
benchmark run #3 has 26093 processes
I believe the most likely cause is that the benchmark didn’t quite do a thorough “clean” between successive invocations of make(1) and hence different work gets done in the three iterations. This is true on both AMD and Intel and an “average” is reported, so more an interesting artifact of the benchmark than a different that affects the comparison.
utime:    3393.401616
stime:    214.175804
maxrss:   198K
minflt:   95081555
majflt:   47
nswap:    0
inblock:  314304
oublock:  4058656
msgsnd:   0
msgrcv:   0
nsignals: 0
nvcsw:    357645
nivcsw:   559795
The resource metrics show considerable amounts of I/O with a lot more blocks written than read. It also shows voluntary context switches (e.g. process paused on an I/O read) as a reasonable proportion of involuntary context switches (e.g. time slice expired). Not sure I trust the “maxrss” value that comes from getrusage(2) call I made for this report (methodology used).
Process Tree - phoronix/build-linux-kernel
Process Tree
The process tree file is large, so let me summarize a count of how many of each process are found:
   4571 sh
   3554 bash
   3188 rm
   2662 gcc
   2570 as
   2539 cc1
   2396 mv
   2386 fixdep
   1614 cat
    986 tr
    977 make
    601 ar
    511 sed
    248 wc
     70 ld
     45 grep
     39 collect2
     16 pnmtologo
     14 mkdir
     12 sort
     12 pkg-config
     12 objcopy
     10 readelf
      9 nm
      9 getconf
      7 tail
      7 basename
      6 uname
      6 find
      6 cut
      3 xargs
      3 relocs
      3 awk
      2 whoami
      2 vdso2c
      2 stat
      2 objdump
      2 modpost
      2 mktemp
      2 kallsyms
      2 hostname
      2 git
      2 expr
      2 date
      2 cmp
      1 uniq
      1 touch
      1 time-compile-ke
      1 svn
      1 sortextable
      1 perl
      1 mkpiggy
      1 mk_elfconfig
      1 mkcpustr
      1 ln
      1 gzip
      1 gen_init_cpio
      1 genheaders
      1 gen_crc32table
      1 dirname
      1 conmakehash
      1 conf
      1 build
      1 bc
 About this graph
Overall, the cores are being kept busy within a 90% plus range.
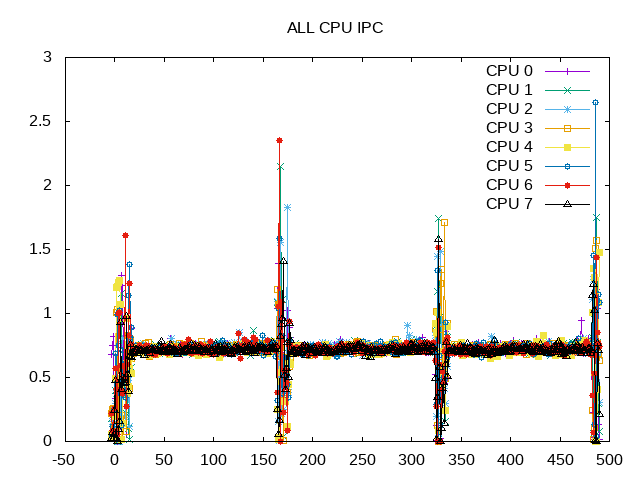
Ignore the spikes between workloads and the IPC is surprisingly constant across these ~29,000 process invocations.
 About this graph
Front end stalls are particularly high compared with other workloads. Speculation is also slightly higher.
Next steps: Deeper dives into front end issues looking at iTLB, iCache, etc.