
This is a test of ab, which is the Apache benchmark program. This test profile measures how many requests per second a given system can sustain when carrying out 1,000,000 requests with 100 requests being carried out concurrently.
As shown in the process tree below, the benchmark has two components: a driver process that sits on one core firing requests and runs for ~40 seconds and a backend server process that spawns 140 other http server processes and runs for all three test runs (3×40 seconds or ~120 seconds).
Metrics (Intel) - phoronix/apachehttpd - pid 22462 // backend server process On_CPU 0.403 On_Core 3.224 IPC 0.376 Retire 0.227 (22.7%) FrontEnd 0.579 (57.9%) Spec 0.055 (5.5%) Backend 0.139 (13.9%) Elapsed 128.05 Procs 141 Minflt 3605491 Majflt 0 Utime 123.05 (29.8%) Stime 289.72 (70.2%) Start 492389.33 Finish 492517.38 sh - pid 22548 // test driver process On_CPU 0.119 On_Core 0.950 IPC 0.709 Retire 0.414 (41.4%) FrontEnd 0.597 (59.7%) Spec 0.069 (6.9%) Backend -0.080 (-8.0%) Elapsed 39.70 Procs 3 Minflt 24199 Majflt 0 Utime 6.07 (16.1%) Stime 31.65 (83.9%) Start 492395.34 Finish 492435.04
Several things to notice looking at the metrics: (1) the overall On_CPU shows ~50% of time these processes are scheduled to run. The single-threaded driver runs almost 95% of available time on one core and the backend httpd processes are scheduled for an additional ~40% of the time (2) unlike other workloads, system time is much larger than user time (3) the workload is dominated by frontend stalls and (4) resultant IPC is low, particularly for the server processes.
The resource information seems to cover only the driver process
utime:    18.260033
stime:    91.617663
maxrss:   67K
minflt:   120876
majflt:   17
nswap:    0
inblock:  5648
oublock:  696
msgsnd:   0
msgrcv:   0
nsignals: 0
nvcsw:    1398
nivcsw:   55255
This is where I think the backend resource usage might be at least as interesting.
Metrics (AMD) - phoronix/apache
The corresponding metrics for AMD
httpd - pid 19065 // backend server process
	On_CPU   0.281
	On_Core  4.491
	IPC      0.445
	FrontCyc 0.118	(11.8%)
	BackCyc  0.061	(6.1%)
	Elapsed  140.57
	Procs    141
	Minflt   3325724
	Majflt   0
	Utime    193.55  	(30.7%)
	Stime    437.80  	(69.3%)
	Start    151935.29
	Finish   152075.86

sh - pid 19151 // test driver process
	On_CPU   0.062
	On_Core  0.985
	IPC      0.747
	FrontCyc 0.133	(13.3%)
	BackCyc  0.094	(9.4%)
	Elapsed  44.23
	Procs    3
	Minflt   24207
	Majflt   0
	Utime    4.93    	(11.3%)
	Stime    38.65   	(88.7%)
	Start    151941.29
	Finish   151985.52
A few things to note in comparison (1) the workload itself still launches 140 backend server processes and doesn’t scale based on twice the number of cores (2) correspondingly the On_CPU percentages also drop with the same work being spread across more cores.

Looking at the sum total of time scheduled on all cores shows the dominance of system time over user time.
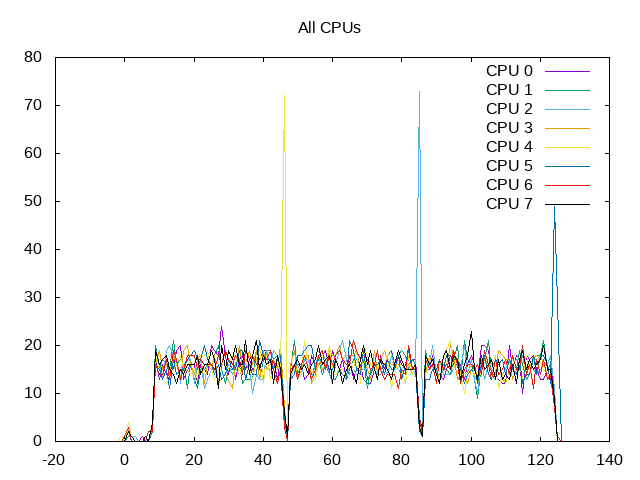 About this graph
Broken out by core, my graph is only of user time, but shows an effort by OS to keep scheduling on different cores.
Process Tree - phoronix/apache
Process Tree
The process tree has two components. The benchmark driver is single threaded:
   22548) sh elapsed=39.70 start=7.87 finish=47.57 pcount=3
      22549) apache elapsed=39.70 start=7.87 finish=47.57 pcount=2
        22550) ab elapsed=39.70 start=7.87 finish=47.57 pcount=1
The backend server looks like this
22462) httpd elapsed=128.05 start=0.00 finish=128.05 pcount=141
  22464) httpd elapsed=128.00 start=0.00 finish=128.00 pcount=1
  22465) httpd elapsed=127.99 start=0.00 finish=127.99 pcount=1
  22466) httpd elapsed=0.01 start=0.00 finish=0.01 pcount=1
  22467) httpd elapsed=128.00 start=0.00 finish=128.00 pcount=1
  22468) httpd elapsed=127.99 start=0.00 finish=127.99 pcount=1
  22469) httpd elapsed=128.00 start=0.00 finish=128.00 pcount=1
  22470) httpd elapsed=0.01 start=0.00 finish=0.01 pcount=1
  22471) httpd elapsed=128.00 start=0.00 finish=128.00 pcount=1
  22472) httpd elapsed=127.99 start=0.00 finish=127.99 pcount=1
  22473) httpd elapsed=0.01 start=0.00 finish=0.01 pcount=1
  22474) httpd elapsed=128.00 start=0.00 finish=128.00 pcount=1
  22475) httpd elapsed=127.99 start=0.00 finish=127.99 pcount=1
...
with a few processes having short duration but most present for the entire run.
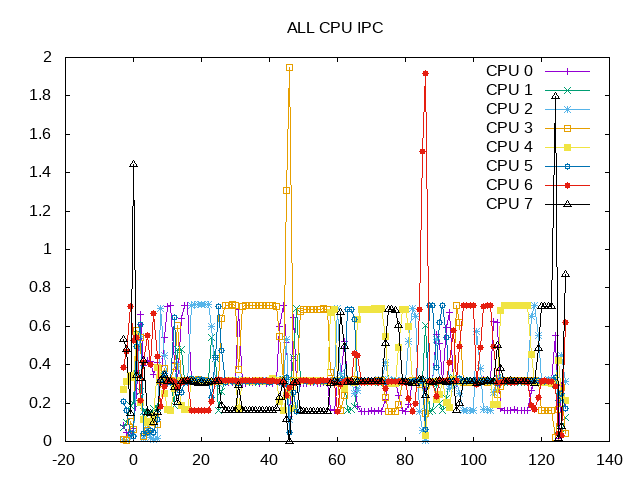
The IPC (measured for both server and core together) is low.
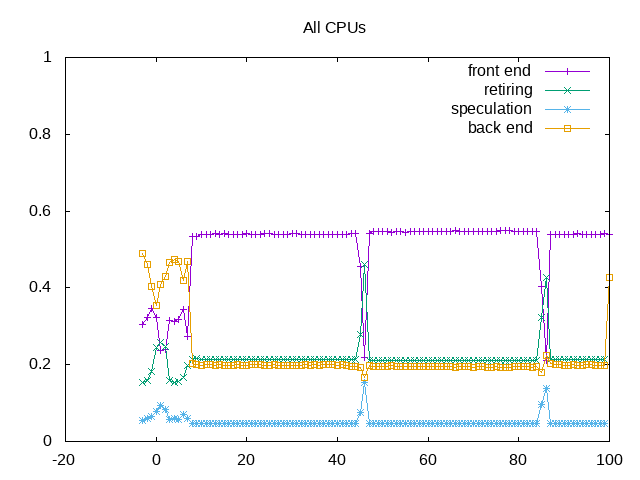 About this graph
This is very much a front-end dominated benchmark.
Next steps: Apache is unique in being both heavily system code and heavily dominated by stalls in the front end. Drill down on both aspects (by the way did this change with recent meltdown patches?), to understand further reasons.