
This test times how long it takes to build the GNU Compiler Collection (GCC).
The test example below was building the latest (gcc 7.2.0) compiler. As part of the benchmark setup, it goes through a “download_prerequisites” step and also builds with the environment on the local system. Hence, this will make the benchmark robust to different environments, but also introduces an additional variable. The benchmark might behave differently not only because of different processors, but also of different execution environments.
Metrics (Intel) - phoronix/build-gccsh - pid 22890 On_CPU 0.722 On_Core 5.775 IPC 0.868 Retire 0.345 (34.5%) FrontEnd 0.361 (36.1%) Spec 0.210 (21.0%) Backend 0.083 (8.3%) Elapsed 1321.26 Procs 353475 Maxrss 633K Minflt 164920285 Majflt 0 Nvcsw 2584028 (68.0%) Nivcsw 1214887 Utime 7272.709321 Stime 357.995173 Start 157412.07 Finish 158733.33
The overall benchmark takes 22 minutes to build. During that time, parts of the build are parallel (e.g. many compiles) and parts are serial (e.g. a single link), hence the “On_CPU” amount is 0.722 partially because of inherent parallelism limits in the build and this might go down with more cores and time stretching out slightly. Having 68% of the context switches be voluntary suggests either I/O or more shorter processes or both.
Both the amount of speculative misses and the amount of front-end stalls are above average on average compared with other workloads. The total number of processes is over 350,000 and the benchmark runs 3x making this a reasonable stress test for wspy processtree generation with >1,000,000 total processes. Otherwise the process tree is too large to include here, but an inventory of what processes run follows. Many are short-lived where on-average each process accumulates 0.022 seconds of user+system time.
 136379 bash
  46703 sed
  28526 rm
  19807 cat
  15836 basename
  15039 as
  12145 cc1
  11336 xgcc
  10630 mv
   4918 autoconf
   4563 grep
   4174 expr
   4077 dirname
   4053 cc1plus
   3655 mkdir
   2996 ld
   2679 gcc
   2667 collect2
   2179 rmdir
   2175 ln
   2084 xg++
   1581 cp
   1406 ?
   1328 strip
   1113 file
   1080 which
    948 uname
    939 g++
    678 cmp
    627 config.status
    533 print
    505 make
    495 automake
    472 sort
    466 tr
    463 chmod
    452 mawk
    350 f951
    330 gfortran
    285 conftest
    232 touch
    225 hostname
    216 ar
    182 ls
    169 diff
    168 fixincl
    150 nm
    146 awk
    122 ranlib
     80 objdump
     79 echo
     75 install
     65 sh
     64 mktemp
     64 find
     61 arch
     54 tmpmultilib3
     49 a.out
     42 uniq
     42 getconf
     39 makeinfo
     38 sleep
     30 tmpmultilib4
     27 cc
     24 tmpmultilib
     24 msgmerge
     24 cut
     18 msgfmt
     18 dd
     16 true
     14 move-if-change
     12 xgettext
     12 mt
     12 genhooks
     11 cc1obj
      9 genpreds
      9 genmodes
      8 perl
      8 genchecksum
      6 tmpmultilib2
      6 realpath
      6 od
      6 ld.gold
      6 genmatch
      6 gengtype
      6 gen-fib
      6 gencfn-macros
      6 gen-bases
      5 pod2man
      4 tar
      3 tail
      3 readelf
      3 mkheader.sh
      3 head
      3 gen-trialdivtab
      3 gentarget-def
      3 genrecog
      3 gen-psqr
      3 genpeep
      3 genoutput
      3 genopinit
      3 genmddeps
      3 gen-jacobitab
      3 gengenrtl
      3 genflags
      3 gen-fac
      3 genextract
      3 genenums
      3 genemit
      3 genconstants
      3 genconfig
      3 gencondmd
      3 genconditions
      3 gencodes
      3 gencheck
      3 genautomata
      3 genattrtab
      3 genattr-common
      3 genattr
      3 gcov-iov
      3 date
      3 c++filt
      3 bison
      2 pwd
      1 build-gcc
Metrics (AMD) - phoronix/build-gcc
sh - pid 31588
        On_CPU   0.491
        On_Core  7.848
        IPC      0.856
        FrontCyc 0.238  (23.8%)
        BackCyc  0.099  (9.9%)
        Elapsed  1108.81
        Procs    353642
        Maxrss   633K
        Minflt   165383257
        Majflt   0
        Nvcsw    2534566        (66.8%)
        Nivcsw   1261566
        Utime    8251.230752
        Stime    450.955154
        Start    466348.86
        Finish   467457.67
Comparing the metrics on my AMD system, the On_CPU percentage has dropped from 72% to 49% reflecting the workload isn’t as able to take advantage of extra cores as the serial parts of the build dominate. Otherwise the IPC is similar.
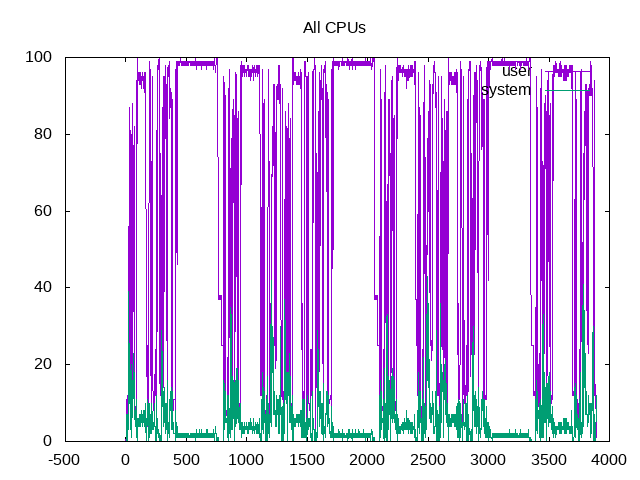
Plotting the total user time and system time across all cores shows times where the build is parallel and when it is much more intermittently single-threaded.
 About this graph
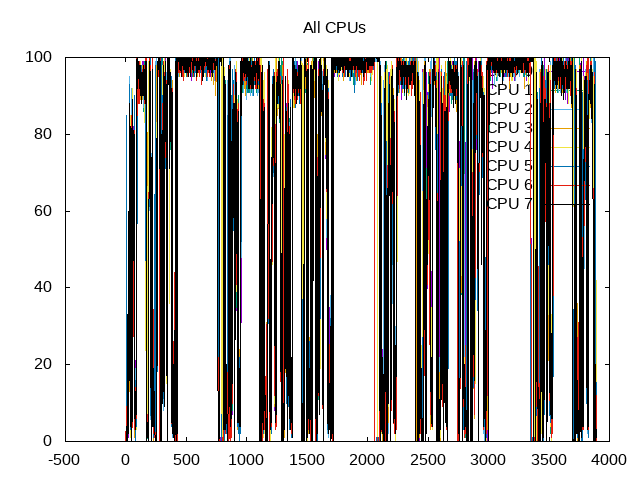
Same plot as before, but separated out by core shows similar behavior.
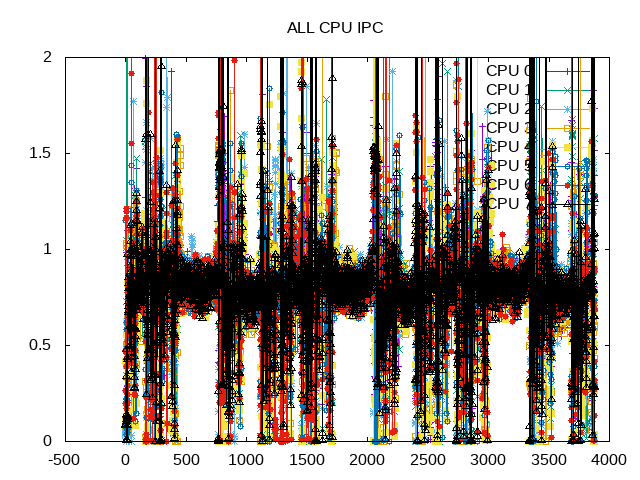
The overall IPC mostly stays in a band slightly lower than 1.
 About this graph
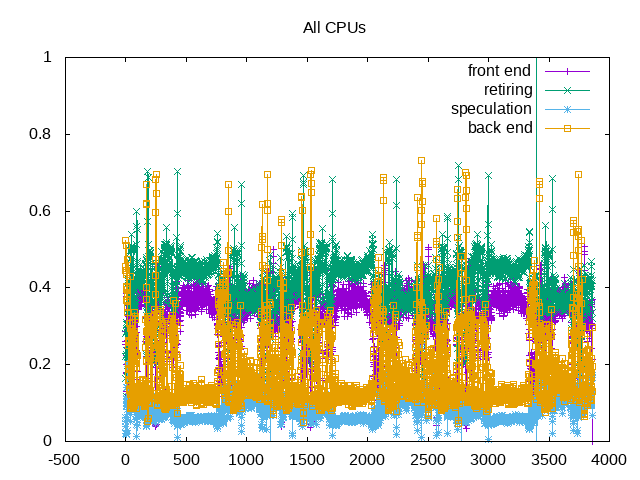
Front end tends to be the largest blocking issue, but also moderate amounts of bad speculation.
Next steps: Drill down further into front end stall to characterize further.