I have found the counters necessary for wspy to get memory reads/writes.
It wasn’t completely straightforward, so this documents the steps I took.
Continue reading →

I have found the counters necessary for wspy to get memory reads/writes.
It wasn’t completely straightforward, so this documents the steps I took.
Continue reading →
There was an article posted on phoronix comparing several Linux servers including POWER9, Intel and AMD EPYX.
Analysis for this article was minimal; so in this post I dug in a bit more on characteristics of the benchmarks of what was actually being compared. I also ran the tests on my i7-4770 system to get a reference. I went through all the benchmarks to do the next level of diagnosis and characterization and provided links in the table below.
NOTE: The diagnosis pages are slowly being updated to reflect newer tools and methods.
| Benchmark | Better | i7-4770 | EPYC 7601 | Notes |
|---|---|---|---|---|
| parboil LBM | lower | 194.95 | 37.39 | Diagnosis |
| parboil CUTCP | lower | 14.40 | 2.61 | Diagnosis |
| parboil Stencil | lower | 26.81 | 14.26 | Diagnosis |
| x264 | higher | 36.15 | 128.17 | Diagnosis |
| 7-zip | higher | 20248 | 79708 | Diagnosis |
| Timed GCC build | lower | 1281.00 | 707.34 | Diagnosis |
| Timed kernel build | lower | 156.20 | 35.66 | Diagnosis |
| Stockfish | lower | 3474 | 4474 | Diagnosis |
| Encode-flac | lower | 10.93 | 11.79 | Diagnosis |
| Encode-mp3 | lower | 32.74 | 43.57 | Diagnosis |
| OpenSSL | higher | 635.57 | 4598.47 | Analysis |
| Pybench | lower | 1462 | 2216 | Diagnosis |
| PHPbench | higher | 537847 | 393659 | Diagnosis |
| OSbench: threads | lower | 9.50 | 30.71 | Analysis |
| OSbench: process | lower | ERROR fork()->EAGAIN | 59.61 | N/A |
| OSbench: memory | lower | 82.46 | 95.14 | Analysis |
I kicked off a quick run through >100 Phoronix tests to get a quick profile and overall assessment, results from table below. A few items noted:
Otherwise a rough cut filter, but useful to get a first screen of tests as well as testing of wspy tool. The table below is also linked in the “workloads” menu item and can be updated as I learn more about the tests.
| Test | Phoronix Summary | Diagnosis | Single vs. Multi-Threaded | Runtime | # processes | Notes | Root |
|---|---|---|---|---|---|---|---|
| aobench | AOBench is a lightweight ambient occlusion renderer, written in C. The test profile is using a size of 2048 x 2048. | single | 42s x 7 | 2 | ./aobench | ||
| apache | This is a test of ab, which is the Apache benchmark program. This test profile measures how many requests per second a given system can sustain when carrying out 1,000,000 requests with 100 requests being carried out concurrently. | multi | 40s x 3 | 118 | Heavier use of system time than user time. | httpd | |
| asmfish | This is a test of asmFish, an advanced chess benchmark written in Assembly. | multi | 240s x 3 | 11 | ./asmfish | ||
| blake2 | This is a benchmark of BLAKE2 using the blake2s binary. BLAKE2 is a high-performance crypto alternative to MD5 and SHA-2/3. | single | 2s x 3 | 2 | ./blake2 | ||
| blender | Blender is an open-source 3D creation software project. This test is of Blender's Cycles benchmark with various sample files. GPU computing via OpenCL or CUDA is supported. | multiple cores, but not symmetric and perhaps not all | 6 hours | 27 | /usr/lib/php/sessionclean | ||
| blogbench | BlogBench is designed to replicate the load of a real-world busy file server by stressing the file-system with multiple threads of random reads, writes, and rewrites. The behavior is mimicked of that of a blog by creating blogs with content and pictures, modifying blog posts, adding comments to these blogs, and then reading the content of the blogs. All of these blogs generated are created locally with fake content and pictures. | multi | 300s x 3 | 114 | 90% time is system, 10% user time. | ./blogbench | |
| bork | Bork is a small, cross-platform file encryption utility. It is written in Java and designed to be included along with the files it encrypts for long-term storage. This test measures the amount of time it takes to encrypt a sample file. | single | 10s x 6 | 20 | runs on more than one core, but overall utilization dominated by single cores | /usr/bin/java | |
| botan | Botan is a cross-platform open-source C++ crypto library that supports most all publicly known cryptographic algorithms. | single | 25s x 3 | 2 | ./botan | ||
| build-apache | This test times how long it takes to build the Apache HTTP Server. | multi | 30s x 3 | 12052 | large #s of very small processes | /bin/bash | |
| build-boost-interprocess | This test times how long it takes to build Boost Interprocess examples. | Error "-std=c ++11 not found". Potentially need to pass in $CXX environment variable? Needs investigation | |||||
| build-eigen | This test times how long it takes to build all Eigen examples. | Build error, potentially missing $CXX variable. Needs investigation | |||||
| build-firefox | This test times how long it takes to build the Firefox Web Browser. | Exit non-zero exit status. Firefox directory not present. Needs investigation | |||||
| build-gcc | This test times how long it takes to build the GNU Compiler Collection (GCC). | Diagnosis | multi | 22m x 3 | 1840 | /bin/bash | |
| build-imagemagick | This test times how long it takes to build ImageMagick. | multi | 70s x 3 | 9479 | /bin/bash | ||
| build-linux-kernel | This test times how long it takes to build the Linux kernel. | Diagnosis | multi | 180s x 3 | 2585 | /bin/bash | |
| build-llvm | This test times how long it takes to build the LLVM compiler stack. | multi | 15m x 3 | 1491 | /bin/bash | ||
| build-mplayer | This test times how long it takes to build the MPlayer media player program. | Error during build needs investigation. | |||||
| build-php | This test times how long it takes to build PHP 5 with the Zend engine. | multi | 90s x 3 | 9106 | /bin/bash | ||
| build-webkitfltk | This test times how long it takes to build the WebKitFLTK web library. | Error during build needs investigation. | |||||
| bullet | This is a benchmark of the Bullet Physics Engine. | single | <5s x 7 | 2 | ./bullet | ||
| byte | This is a test of BYTE. | single | 17m | various up to 98 | ./byte | ||
| c-ray | This is a test of C-Ray, a simple raytracer designed to test the floating-point CPU performance. This test is multi-threaded (16 threads per core), will shoot 8 rays per pixel for anti-aliasing, and will generate a 1600 x 1200 image. | Analysis | multi | 26s x 3 | 130 | ./c-ray | |
| cachebench | This is a performance test of CacheBench, which is part of LLCbench. CacheBench is designed to test the memory and cache bandwidth performance | single | 125s x 3 | 3 | ./cachebench | ||
| clomp | CLOMP is the C version of the Livermore OpenMP benchmark developed to measure OpenMP overheads and other performance impacts due to threading in order to influence future system designs. This particular test profile configuration is currently set to look at the OpenMP static schedule speed-up across all available CPU cores using the recommended test configuration. | multi | 6s x 5 | 0 | ./clomp | ||
| compress-7zip | This is a test of 7-Zip using p7zip with its integrated benchmark feature or upstream 7-Zip for the Windows x64 build. | Diagnosis | multi | 40s x 3 | 82 | ./compress-7zip | |
| compress-gzip | This test measures the time needed to archive/compress two copies of the Linux 4.13 kernel source tree using Gzip compression. | single | 40s x 3 | 5 | runs on selective cores | ./compress-gzip | |
| compress-lzma | This test measures the time needed to compress a file using LZMA compression. | single | 280s x 3 | 2 | ./compress-lzma | ||
| compress-pbzip2 | This test measures the time needed to compress a file (a .tar package of the Linux kernel source code) using BZIP2 compression. | multi | 10s x 6 | 13 | ./compress-pbzip2 | ||
| cpuminer-opt | Cpuminer benchmark. | multi | 30s x 3 | 12 | ./cpuminer | ||
| crafty | This is a performance test of Crafty, an advanced open-source chess engine. | single | 30s x 3 | 3 | ./crafty-benchmark | ||
| cyclictest | Cyclictest is a high-resolution test program for measuring the Linux kernel latencies. | single | 50s x 3 | 3 | not cpu-bound | ./cyclictest | |
| cython-bench | Stress benchmark tests to measure time consumed by cython code. | single | 30s x 3 | 2 | ./cython-bench | ||
| dcraw | This test times how long it takes to convert several high-resolution RAW NEF image files to PPM image format using dcraw. | single | 50s x 3 | 2 | ./dcraw | ||
| dolfyn | Dolfyn is a Computational Fluid Dynamics (CFD) code of modern numerical simulation techniques. The Dolfyn test profile measures the execution time of the bundled computational fluid dynamics demos that are bundled with Dolfyn. | No result, needs further investigation | |||||
| ebizzy | This is a test of ebizzy, a program to generate workloads resembling web server workloads. | multi | 20s x 6 | 18 | ./ebizzy | ||
| encode-flac | This test times how long it takes to encode a sample WAV file to FLAC format five times. | Diagnosis | single | 12s x 5 | 6 | ./encode-flac | |
| encode-mp3 | LAME is an MP3 encoder licensed under the LGPL. This test measures the time required to encode a WAV file to MP3 format. | Diagnosis | single | 35s x 3 | 2 | ./lame | |
| encode-ogg | This test times how long it takes to encode a sample WAV file to Ogg format using vorbis-tools, libvorbis, and libogg. | single | 7s x 3 | 2 | ./encode-ogg | ||
| encode-opus | Opus is an open audio codec. Opus is a lossy audio compression format designed primarily for interactive real-time applications over the Internet. This test uses Opus-Tools and measures the time required to encode a WAV file to Opus and then to decode the generated Opus file. | single | 9s x 5 | 4 | ./encode-opus | ||
| encode-wavpack | This test times how long it takes to encode a sample WAV file to WavPack format. | single | 8s x 5 | 2 | ./encode-wavpack | ||
| espeak | This test times how long it takes the eSpeak speech synthesizer to read Project Gutenberg's The Outline of Science and output to a WAV file. | single | 40s x 6 | 3 | ./espeak | ||
| etqw-demo | This test calculates the average frame-rate within the demo for the game Enemy Territory: Quake Wars demo game. | multi (heavy on one CPU) | 300s x 9 | 11 | Initial burst of computation; longer run across threads. Heavy on one CPU | ./etqw | |
| fahbench | FAHBench is a Folding@Home benchmark on the GPU. | No result, needs further investigation | |||||
| ffmpeg | This test uses FFmpeg for testing the system's audio/video encoding performance. | multi | 10s x 4 | 33 | ./ffmpeg | ||
| ffte | FFTE is a package by Daisuke Takahashi to compute Discrete Fourier Transforms of 1-, 2- and 3- dimensional sequences of length (2^p)*(3^q)*(5^r). | single* | 5s x 6 | 10 | Processes started on all CPUs, but all but one are idle. | ./ffte | |
| fftw | FFTW is a C subroutine library for computing the discrete Fourier transform (DFT) in one or more dimensions. | single | 26m, varying time depending on size | 2 | 32 possible options. Interesting to see as performance drops dramatically at particular size. Cache effects? | /bin/sh | |
| fhourstones | This integer benchmark solves positions in the game of Connect-4, as played on a vertical 7x6 board. By default, it uses a 64Mb transposition table with the twobig replacement strategy. Positions are represented as 64-bit bitboards, and the hash function is computed using a single 64-bit modulo operation, giving 64-bit machines a slight edge. The alpha-beta searcher sorts moves dynamically based on the history heuristic. | single | 15s x 3 | 2 | ./fhourstones-benchmark | ||
| fio | Fio is an advanced disk benchmark that depends upon the kernel's AIO access library. | single, several threads | Large time due to 2048 combinations | 12 | 2048 combinations, batch run tries them all. Mostly system time. | ./fio-run | |
| gcrypt | This is a benchmark of libgcrypt's integrated benchmark with the CAMELLIA256-ECB cipher and 100 repetitions. | 3 | Compilation errors during installation. | ||||
| git | This test measures the time needed to carry out some sample Git operations on an example, static repository that happens to be a copy of the GNOME GTK tool-kit repository. | multi | 6s x 3 | 58 | ./git | ||
| glibc-bench | The GNU C Library project provides the core libraries for the GNU system and GNU/Linux systems, as well as many other systems that use Linux as the kernel. These libraries provide critical APIs including ISO C11, POSIX.1-2008, BSD, OS-specific APIs and more. | single | 3s x 15 | 2 | warnings that test ended quickly. | ./glibc-bench | |
| gnupg | This test times how long it takes to encrypt a file using GnuPG. | single | 12s x 3 | 2 | ./gnupg | ||
| go-benchmark | Benchmark for monitoring real time performance of the Go implementation for HTTP, JSON and garbage testing per iteration. | multi | 12s x 3 - three workloads | 66 | Three workloads with varying profiles. | ./go-benchmark | |
| gpu-residency | This test measures the GPU residency of a given state for a 60 second interval. | Test quit with non-zero status, needs investigation | |||||
| graphics-magick | This is a test of GraphicsMagick with its OpenMP implementation that performs various imaging tests to stress the system's CPU. | multi | 60s x 3 | 9 | Workloads uneven across CPUs | ./graphics-magick | |
| hackbench | This is a benchmark of Hackbench, a test of the Linux kernel scheduler. | multi | 30m | up to 1008 | 12 options, combinations of threads and processes; 90% system time. | ||
| himeno | The Himeno benchmark is a linear solver of pressure Poisson using a point-Jacobi method. | single | 60s x 3 | 2 | ./himrno | ||
| hint | This test runs the U.S. Department of Energy's Ames Laboratory Hierarchical INTegration (HINT) benchmark. | single | 25m | 2 | Third test hung; problem in tools or test? Needs investigation. | ./hint | |
| hmmer | This test searches through the Pfam database of profile hidden markov models. The search finds the domain structure of Drosophila Sevenless protein. | multi | 10s x 3 | 11 | ./hmmer | ||
| hpcg | HPCG is the High Performance Conjugate Gradient and is a new scientific benchmark from Sandia National Lans focused for super-computer testing with modern real-world workloads compared to HPCC | multi | 55s x 3 | 12 | All ~30% busy; investigate idle times. | ./hpcg | |
| interbench | Interbench is an interactivity benchmark written by Con Kolivas. Interbench is primarily intended to test out the system kernel and its CPU scheduler while running a simulated test with a given simulated load in the background. Each benchmark / load is run for 60 seconds per test. | multi | 4h | 4 | 81 combinations; many with no result | ./interbench | |
| java-jmh | This test runs the stock benchmark of the Java JMH benchmark via Maven. | multi | 7m | 355 | Almost 100% CPU | ./java-jmh | |
| java-scimark2 | This test runs the Java version of SciMark 2.0, which is a benchmark for scientific and numerical computing developed by programmers at the National Institute of Standards and Technology. This benchmark is made up of Fast Foruier Transform, Jacobi Successive Over-relaxation, Monte Carlo, Sparse Matrix Multiply, and dense LU matrix factorization benchmarks. | single | 2m | 21 | 6 tests | ./java-scimark2 | |
| john-the-ripper | This is a benchmark of John The Ripper, which is a password cracker. | multi | (20s+40s+20s ) x 3 | 9 | ./john-the-ripper | ||
| lammps | LAMMPS is a classical molecular dynamics code, and an acronym for Large-scale Atomic/Molecular Massively Parallel Simulator. | Test quit with non-zero exit status, needs investigation | |||||
| llvm-test-suite | This test times how long it takes to run the LLVM Test Suite. | single | 220s x 3 | 1561 | ./llvm-test-suite | ||
| luajit | This test profile is a collection of Lua scripts/benchmarks run against a locally-built copy of LuaJIT upstream. | single | 100s | 2 | Six tests | ./luajit | |
| luxmark | LuxMark is a multi-platform OpenGL benchmark using LuxRender. LuxMark supports targeting different OpenCL devices and has multiple scenes available for rendering. LuxMark is a fully open-source OpenCL program with real-world rendering examples. | Test quit with non-zero exit status, needs investigation | |||||
| lzbench | lzbench is an in-memory benchmark of various compressors. The file used for compression is a Linux kernel source tree tarball. | single | 6m | 2 | ./lzbench | ||
| mafft | This test performs an alignment of 100 pyruvate decarboxylase sequences. | multi | 7s x 6 | 143 | Many short little processes. | ./mafft | |
| mencoder | This test uses mplayer's mencoder utility and the libavcodec family for testing the system's audio/video encoding performance. | single | 20s x 3 | 2 | ./mencoder | ||
| minion | Minion is an open-source constraint solver that is designed to be very scalable. This test profile uses Minion's integrated benchmarking problems to solve. | single | 15m | 2 | Three tests | ./minion | |
| mrbayes | This test performs a bayesian analysis of a set of primate genome sequences in order to estimate their phylogeny. | Test quit with non-zero exit status, needs investigation | |||||
| multichase | This is a benchmark of Google's multichase pointer chaser program. | single & multi | 100s | 3 | Five tests | ./multichase | |
| n-queens | This is a test of the OpenMP version of a test that solves the N-queens problem. The board problem size is 18 | multi | 35s x 3 | 9 | Almost 100% busy | ./n-queens | |
| nero2d | This is a test of Nero2D, which is a two-dimensional TM/TE solver for Open FMM. Open FMM is a free collection of electromagnetic software for scattering at very large objects. This test profile times how long it takes to solve one of the included 2D examples. | Test quit with non-zero exit status, needs investigation | |||||
| network-loopback | This test measures the loopback network adapter performance using a micro-benchmark to measure the TCP performance. | Test quit with non-zero exit status, needs investigation | |||||
| nginx | This is a test of ab, which is the Apache Benchmark program running against nginx. This test profile measures how many requests per second a given system can sustain when carrying out 2,000,000 requests with 500 requests being carried out concurrently. | single | 60s x 3 | 2 | Heavier on system time than user time. | ./nginx | |
| noise-level | This test measures background activity. | single | 60s | 14 | Runs sleep | ./noise-level | |
| numpy | This is a test to obtain the general Numpy performance. | single | 45m | 38 | ./numpy | ||
| openssl | OpenSSL is an open-source toolkit that implements SSL (Secure Sockets Layer) and TLS (Transport Layer Security) protocols. This test measures the RSA 4096-bit performance of OpenSSL. | Analysis | multi | 20s x 3 | 9 | ./openssl | |
| opm-git | This is a test of a DUNE (Distributed and Unified Numerics Environment) module called OPM Benchmarks from the Open Porous Media project. Open Porous Media is a set of open-source tools concerning simulation of flow and transport of fluids in porous media. This test profile builds OPM and its dependencies from upstream Git. | Test quit with non-zero exit status, needs investigation | |||||
| osbench | OSBench is a collection of micro-benchmarks for measuring operating system primitives like time to create threads/processes, launching programs, creating files, and memory allocation. | Diagnosis | wspy hangs because incorrect tree has been built. Further debugging shows "fork()" is failing with EAGAIN errno. This also causes the test to fail when not run under wspy; two fixes required - (1) look at conditions described in fork(2) system call to avoid the failure and (2) fix wspy to properly handle fork calls that might fail. | ||||
| padman | World of Padman is an open-source game using the ioquake3 engine. What makes this game different from other first-person shooters is that it's a cartoon-style action game. | multi (heavy on one CPU) | 120s x 9 | 7 | Game | ./padman | |
| parboil | The Parboil Benchmarks from the IMPACT Research Group at University of Illinois are a set of throughput computing applications for looking at computing architecture and compilers. Parboil test-cases support OpenMP, OpenCL, and CUDA multi-processing environments. However, at this time the test profile is just making use of the OpenMP and OpenCL test workloads. | Diagnosis | multi | 25m | 13 | Ten tests, six didn't run correctly. Missing OpenCL | ./parboil |
| perl-benchmark | Perl benchmark suite that can be used to compare the relative speed of different versions of perl. | multi | 80s, 67s, 70s, 28s, 66s, 66s, 70s | 22, 21264, 21407, 8639, 21492, 21521, 21834 | More than 100,000 processes created; system time exceeds user time. | ./perl-benchmark | |
| pgbench | This is a simple benchmark of PostgreSQL using pgbench. | Test must be run as non-root; extremely long runtime. | |||||
| phpbench | PHPBench is a benchmark suite for PHP. It performs a large number of simple tests in order to bench various aspects of the PHP interpreter. PHPBench can be used to compare hardware, operating systems, PHP versions, PHP accelerators and caches, compiler options, etc. The number of iterations used is 1,000,000. | Diagnosis | single | 20s x 3 | 2 | ./phpbench | |
| polybench-c | PolyBench-C is a C-language polyhedral benchmark suite made at the Ohio State University. | single | 30s | 2 | Three workloads, last longer than first two | ./polybench | |
| postmark | This is a test of NetApp's PostMark benchmark designed to simulate small-file testing similar to the tasks endured by web and mail servers. This test profile will set PostMark to perform 25,000 transactions with 500 files simultaneously with the file sizes ranging between 5 and 512 kilobytes. | single | 40s x 3 | 2 | Mostly system time. | ./postmark | |
| povray | This is a test of POV-Ray, the Persistence of Vision Raytracer. POV-Ray is used to create 3D graphics using ray-tracing. | multi | 135s x 3 | 29 | ./povray | ||
| primesieve | Primesieve generates prime numbers using a highly optimized sieve of Eratosthenes implementation. Primesieve benchmarks the CPU's L1/L2 cache performance. | multi | 85s x 3 | 9 | Almost 100% user | ./primesieve | |
| psstop | Shows the total number of processes running and the memory they consume. | single | <1s | 5 | Extremely short duration | ./psstop | |
| pybench | This test profile reports the total time of the different average timed test results from PyBench. PyBench reports average test times for different functions such as BuiltinFunctionCalls and NestedForLoops, with this total result providing a rough estimate as to Python's average performance on a given system. This test profile runs PyBench each time for 20 rounds. | Diagnosis | single | 30s x 3 | 5 | ./pybench | |
| ramspeed | This benchmark tests the system memory (RAM) performance. | double | 120s x 10 | 3 | Naming suggests varations of double-threaded stream | ./ramspeed | |
| rbenchmark | This test is a quick-running survey of general R performance | single | 0.5s x 3 | 11 | ./rbenchmark | ||
| redis | Redis is an open-source data structure server. | single* (multi-core but most computation on single core) | 11s x 15 | 4 | short bursts of activity, mostly idle | ./redis | |
| rodinia | Rodinia is a suite focused upon accelerating compute-intensive applications with accelerators. CUDA, OpenMP, and OpenCL parallel models are supported by the included applications. This profile utilizes the OpenCL and OpenMP test binaries at the moment. | multiple | 18m | 9 | Only three of nine benchmarks ran out of the box | ./rodinia | |
| sample-program | A simple C++ program that calculates Pi to 8,765,4321 digits using the Leibniz formula. This test can be used for showcasing how to write a basic test profile. | single | 3s x 5 | 2 | ./sample-program | ||
| schbench | This is a benchmark of Schbench, a Linux kernel scheduler benchmark developed by Facebook. | multiple | 90m | 13 | 42 different subtests | ./schbench | |
| scimark2 | This test runs the ANSI C version of SciMark 2.0, which is a benchmark for scientific and numerical computing developed by programmers at the National Institute of Standards and Technology. This test is made up of Fast Foruier Transform, Jacobi Successive Over-relaxation, Monte Carlo, Sparse Matrix Multiply, and dense LU matrix factorization benchmarks. | single | 25s x 3 | 2 | ./scimark2 | ||
| serial-loopback | This test will do a simple write/read test on all detected serial interfaces. For this test to work, the relevant serial ports should have a serial loopback plug or have otherwise wired the appropriate pins. | Test quit with non-zero exit status, needs investigation | |||||
| smallpt | Smallpt is a C++ global illumination renderer written in less than 100 lines of code. Global illumination is done via unbiased Monte Carlo path tracing and there is multi-threading support via the OpenMP library. | multi | 80s x 3 | 9 | ./smallpt | ||
| stockfish | This is a test of Stockfish, an advanced C++11 chess benchmark that can scale up to 128 CPU cores. | Diagnosis | single* (multi-core but most computation on single core) | 4s x 3 | 4 | ./stockfish | |
| stream | This benchmark tests the system memory (RAM) performance. | Diagnosis | multi | 50s x 5 | 9 | ./stream | |
| sudokut | This is a test of Sudokut, which is a Sudoku puzzle solver written in Tcl. This test measures how long it takes to solve 100 Sudoku puzzles. | single | 12s x 3 | 101 | Runs same process 100 times | ./sudokut | |
| sunflow | This test runs benchmarks of the Sunflow Rendering System. The Sunflow Rendering System is an open-source render engine for photo-realistic image synthesis with a ray-tracing core. | multi | 30s x 3 | 182 | ./sunflow-benchmark | ||
| system-decompress-bzip2 | This test measures the time to decompress a Linux kernel tarball using BZIP2. | single | 10s x 3 | 2 | ./system-decompress-bzip2 | ||
| system-decompress-xz | This test measures the time to decompress a Linux kernel tarball using XZ. | single | 4s x 3 | 2 | ./system-decompress-xz | ||
| system-libxml2 | This test measures the time to parse a random XML file with libxml2 via xmllint using the streaming API. | Test quit with non-zero exit status, needs investigation | |||||
| systemd-boot-kernel | This test uses systemd-analyze to report the kernel boot time. | Test quit with non-zero exit status, needs investigation | |||||
| systemd-boot-total | This test uses systemd-analyze to report the entire boot time. | Test quit with non-zero exit status, needs investigation | |||||
| systemd-boot-userspace | This test uses systemd-analyze to report the userspace boot time. | Test quit with non-zero exit status, needs investigation | |||||
| systester | Time how long it takes to calculate pi to varying lengths. | Test quit with non-zero exit status, needs investigation | |||||
| t-test1 | This is a test of t-test1 for basic memory allocator benchmarks. Note this test profile is currently very basic and the overall time does include the warmup time of the custom t-test1 compilation. Improvements welcome. | single | 30s | 4008 | Two workloads | Many processes, but seems to mostly limited sequentially. | |
| tachyon | This is a test of the threaded Tachyon, a parallel ray-tracing system. | multi | 15s x 3 | 9 | ./tachyon-benchmark | ||
| tensorflow | This is a benchmark of the Tensorflow deep learning framework using the CIFAR10 data set. | multi | 90s x 3 | 50 | Python test | ./tensorflow | |
| tjbench | tjbench is a JPEG decompression/compression benchmark part of libjpeg-turbo. | single | 8s x 3 | 15 | ./tjbench | ||
| tscp | This is a performance test of TSCP, Tom Kerrigan's Simple Chess Program, which has a built-in performance benchmark. | single | 2s x 5 | 2 | ./tscp | ||
| ttsiod-renderer | A portable GPL 3D software renderer that supports OpenMP and Intel Threading Building Blocks with many different rendering modes. This version does not use OpenGL but is entirely CPU/software based. | multi | 30s x 3 | 9 | ./ttsiod-renderer | ||
| vpxenc | This is a standard video encoding performance test of Google's libvpx library and the vpxenc command for the VP8/WebM format. | four | 70s x 6 | 5 | ./vpxenc | ||
| x264 | This is a simple test of the x264 encoder run on the CPU (OpenCL support disabled) with a sample video file. | Diagnosis | multi | 20s x 5 | 11 | ./x264 | |
| xsbench | XSBench is a mini-app representing a key computational kernel of the Monte Carlo neutronics application OpenMC. | multi | 15s x 3 | 9 | ./xsbench | ||
| y-cruncher | Y-Cruncher is a multi-threaded Pi benchmark. | multi | 60s x 3 | 20 | ./y-cruncher |
I have now enhanced wspy to add an option for –diskstats. This option samples, /sys/block/*/stat files to save away disk read and write statistics. The same information is also reported in /proc/diskstats.
Another option added at same time is –set-cpumask which sets the mask of processes that the application can run, essentially a “pin” option to pin the workload only to a particular core or set of cores. I’ve used similar syntax as the taskset –cpulist option.
Added but not yet implemented is –memstats (to pull information from /proc/meminfo) and –netstats (to pull information from /proc/net/dev). The general idea behind all four of these options is as a first cut sampling to find cpu/disk/network/memory profile of an application for a rough triage.
I have enhanced wspy to read performance counters. It now has three different instrumentation methods:
Some future directions are both to extend these subsystems to additional measurements and to make it all more configurable, perhaps with a set of config files and command options.
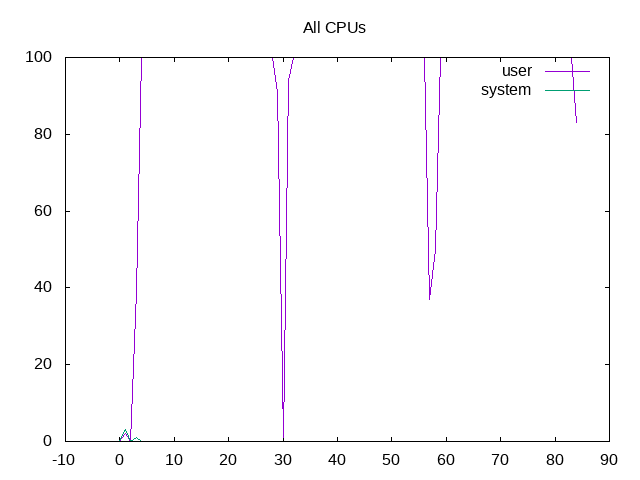
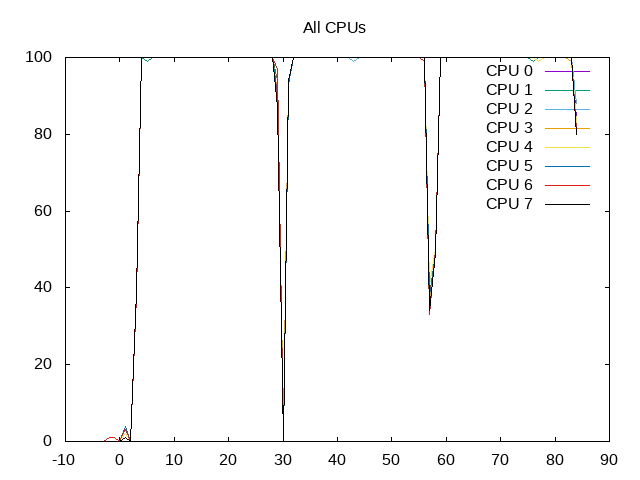
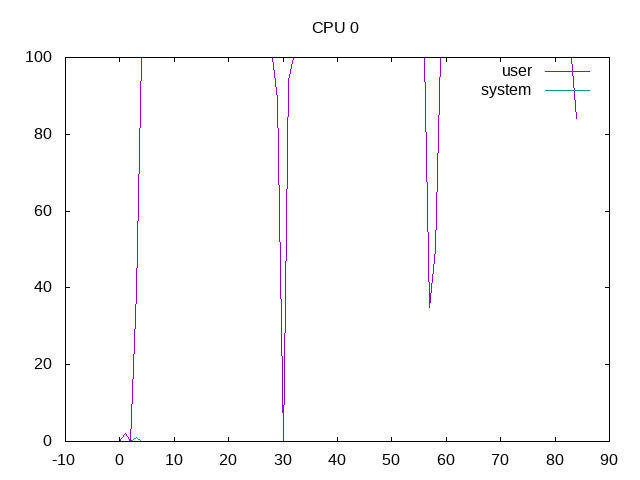
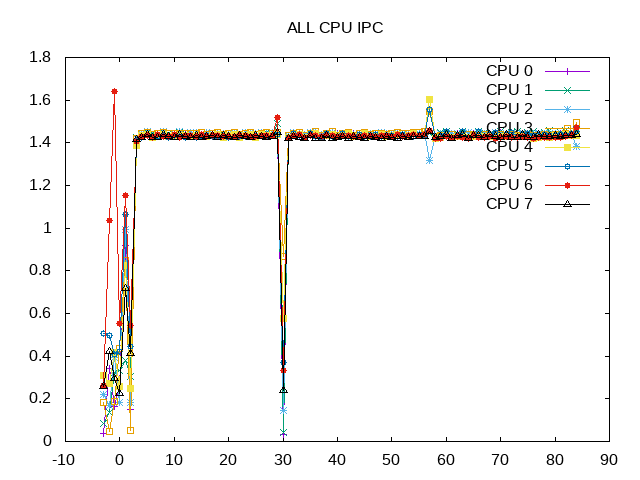
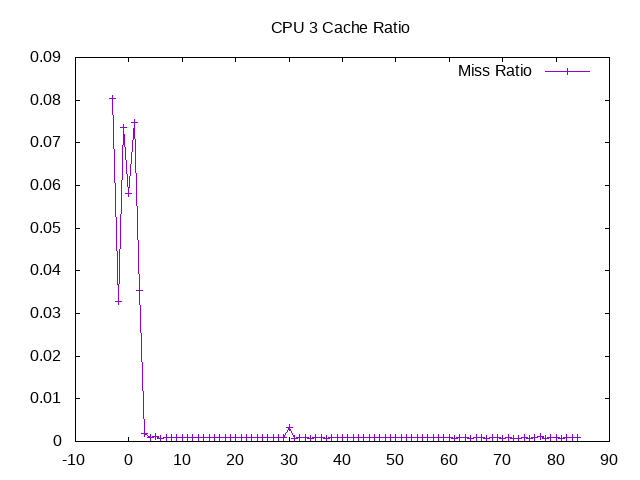
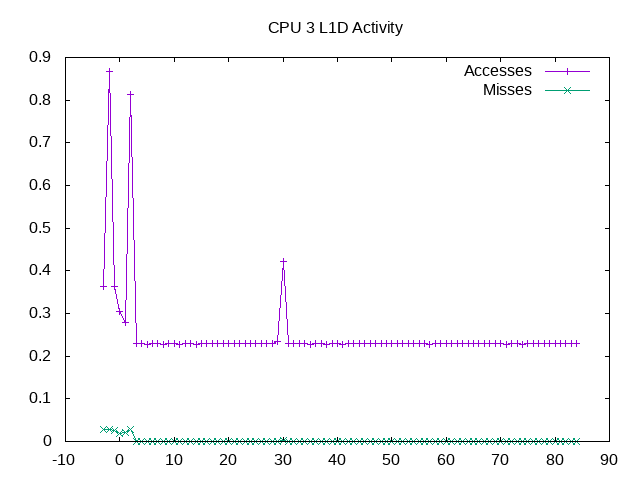
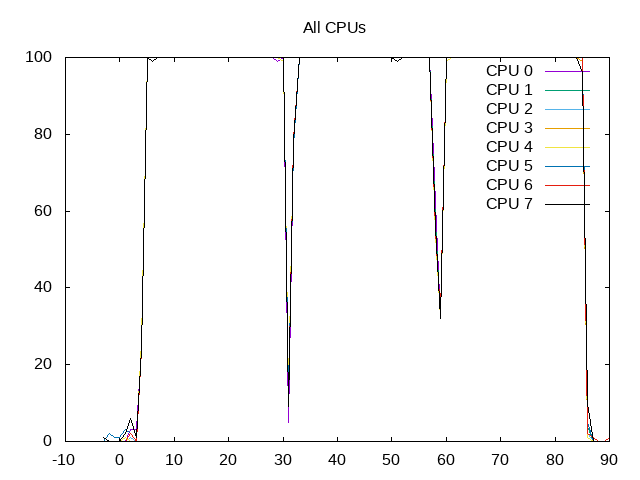
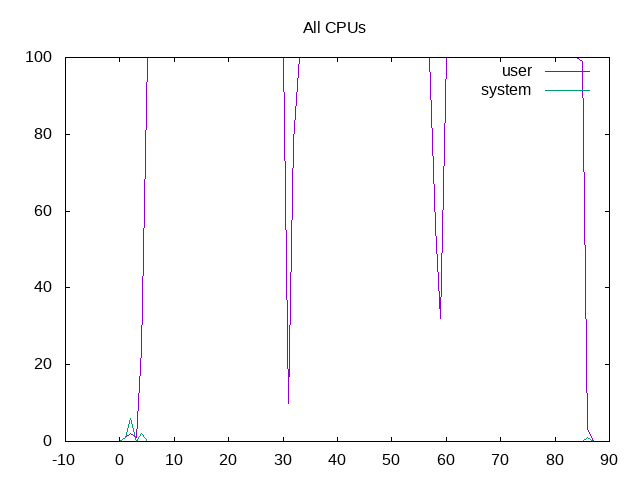
Below are examples of gnuplot graphs coming from wspy:
User and system time for all CPUs (total)
User and system time for all CPUs (separate)
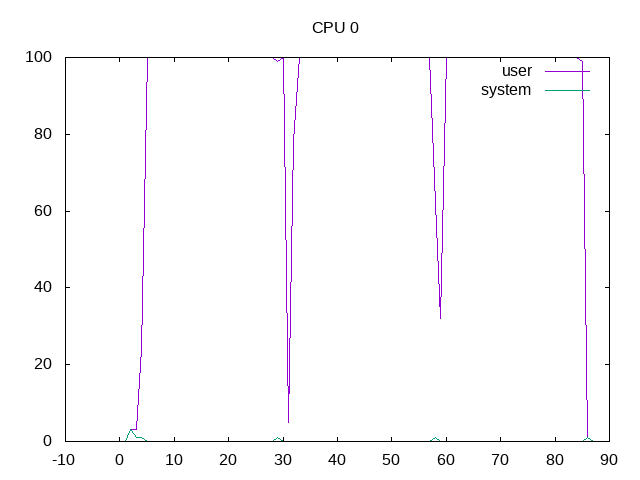
User and system time for one CPU
Instructions per cycle for all CPUs
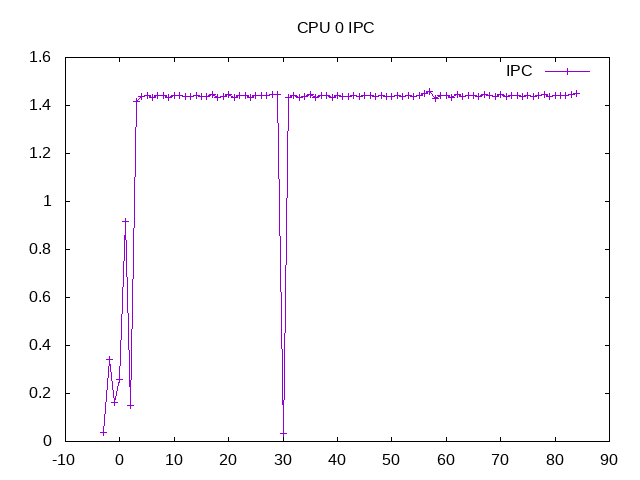
Instructions per cycle for one CPU
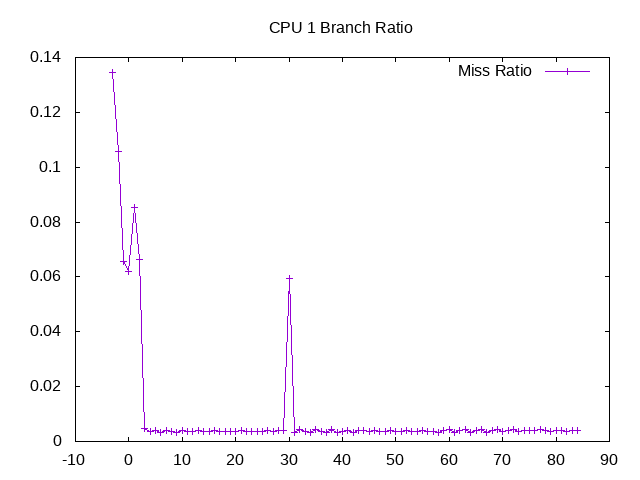
Branch prediction miss rate on one CPU
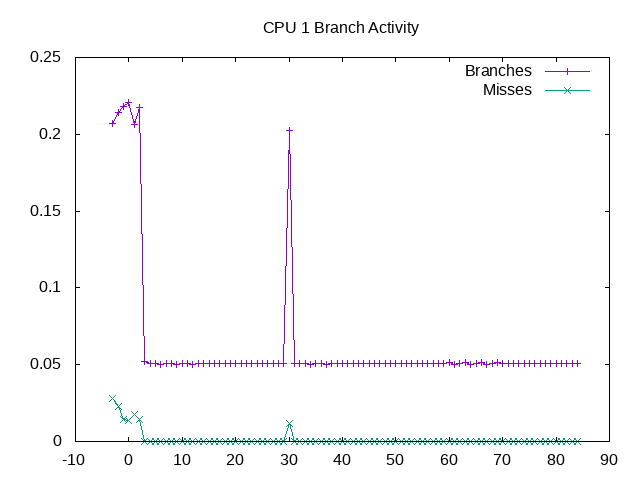
Branch rates on one CPU
Last level cache misses from one CPU
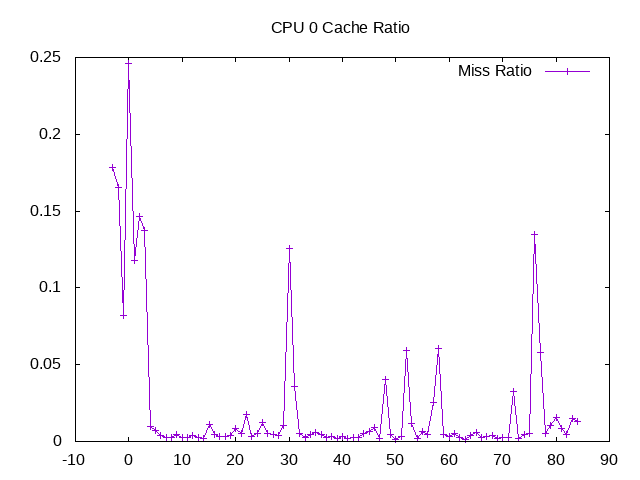
L1D cache miss ratio from one CPU
L1D cache activity
Two improvements have been added to the wspy program:
Below is a short listing showing contents of the zip archive as well as running of the gnuplot script.
mev@popayan:~/wspy-exp$ unzip -l c-ray
Archive:  c-ray.zip
  Length      Date    Time    Name
---------  ---------- -----   ----
     3417  2018-03-23 19:25   allcpu.csv
     2399  2018-03-23 19:25   cpu-gnuplot.sh
     3417  2018-03-23 19:25   cpu0.csv
     3417  2018-03-23 19:25   cpu1.csv
     3417  2018-03-23 19:25   cpu2.csv
     3417  2018-03-23 19:25   cpu3.csv
     3417  2018-03-23 19:25   cpu4.csv
     3417  2018-03-23 19:25   cpu5.csv
     3417  2018-03-23 19:25   cpu6.csv
     3417  2018-03-23 19:25   cpu7.csv
    25725  2018-03-23 19:25   processtree.txt
---------                     -------
    58877                     11 files
mev@popayan:~/wspy-exp$ unzip c-ray.zip
Archive:  c-ray.zip
  inflating: allcpu.csv
  inflating: cpu-gnuplot.sh
  inflating: cpu0.csv
  inflating: cpu1.csv
  inflating: cpu2.csv
  inflating: cpu3.csv
  inflating: cpu4.csv
  inflating: cpu5.csv
  inflating: cpu6.csv
  inflating: cpu7.csv
  inflating: processtree.txt
mev@popayan:~/wspy-exp$ ./cpu-gnuplot.sh
mev@popayan:~/wspy-exp$ ls
allcpu.csv  cpu1.csv  cpu3.csv  cpu5.csv  cpu7.csv        c-ray.zip
allcpu.png  cpu1.png  cpu3.png  cpu5.png  cpu7.png        processtree.txt
cpu0.csv    cpu2.csv  cpu4.csv  cpu6.csv  cpu-gnuplot.sh
cpu0.png    cpu2.png  cpu4.png  cpu6.png  cpulist.png
One CSV file is created for each CPU showing the /proc/stat line each second. A text file is created for the process tree as well.
Below are some examples of the PNG files showing the plots for this benchmark.
Kicked off a run with the Phoronix CPU suite using likwid-perfctr. Benchmarks that were single-threaded were pinned to a single CPU, others to all CPUs.
#!/bin/bash
likwid-perfctr -a | tail +3 | awk '{ print $1 }' | while read group
do
    while read benchmark
    do
	likwid-perfctr -f -c 0-7 -g ${group} --output perfctr-03-15/${group}/cpu
-${benchmark}-perfctr.txt phoronix-test-suite batch-run ${benchmark} > perfctr-0
3-15/${group}/cpu-${benchmark}-output.txt 2>&1
    done < cpu-benchlist.txt
done
A lot of data to still look through, so after the benchmark list, I've placed a table with the results files.
| Test | Cores | CPI |
|---|---|---|
| pts/padman | multi | 1.03 |
| pts/etqw-demo | multi | 0.74 |
| pts/john-the-ripper | multi | 0.67 |
| pts/ttsiod-renderer | multi | 1.16 |
| pts/compress-pbzip2 | multi | 1.09 |
| pts/compress-7zip | multi | 1.20 |
| pts/encode-mp3 | single | 2.11 |
| pts/encode-flac | single | 2.12 |
| pts/x264 | multi | 0.77 |
| pts/ffmpeg | multi | 0.79 |
| pts/openssl | multi | 0.60 |
| pts/himeno | single | 2.16 |
| pts/apache | multi | 2.16 |
| pts/c-ray | multi | 0.70 |
| pts/povray | multi | 0.77 |
| pts/smallpt | multi | 0.84 |
| pts/tachyon | multi | 0.97 |
| pts/crafty | single | 2.14 |
| pts/tscp | single | 2.15 |
| pts/mafft | multi | 0.76 |
| pts/stream | multi | 18.79 |
As one of the first steps inpriming the pump for Phoronix benchmarks, I ran the wspy program on 21 candidate CPU benchmarks. My goal was to start with a rough characterization, e.g. single-threaded vs. multi-threaded or cpu-bound vs not.
#!/bin/bash
while read benchmark
do
    /home/mev/wspy/wspy -o cpu-wspy-${benchmark}.txt phoronix-test-suite batch-r
un ${benchmark} > cpu-${benchmark}.output.txt 2>&1
done < cpu-benchlist.txt
Results are listed below. A few more general comments:
These classifications also give me some additional things to look for when looking further at performance counters.
| Test | Original Score | New Score | Better | Test Output | wspy Output | Behavior of processes/CPUs | notes |
|---|---|---|---|---|---|---|---|
| pts/padman | 198.97 | 198.03 | higher | padman | padman | graphics program calculating frames per second. One CPU very busy while test runs approaching 100% utilization; short bursts on other CPUs particularly at the point tests start. Game that calculates # of frames per second, initial processing time? followed by running # of frames per second? | Nine tests are run; original score is only the last. |
| pts/etqw-demo | 41.80 | 41.70 | higher | etqw-demo | etqw-demo | Graphics program calculating frames per second. Each test starts one process per core (8 total), two are different (name="threaded-ml") so interesting if placement of these threads matters relative to others. CPUs generally run in bursts of activity >50% separated by less loaded times. | Nine tests are run; original score is only the last. |
| pts/john-the-ripper | 5937 blowfish 20593667 des 203603 MD5 | 6078 blowfish 23699000 des 208588 MDS | higher | john-the-ripper | john-the-ripper | All CPUs close to 100% user time. Short tests ~20 seconds per test case. | |
| pts/ttsiod-renderer | 192.87 | 191.88 | higher | ttsiod-renderer | ttsiod-renderer | All CPUs close to 100% user time. Short tests ~30 seconds per test case. | |
| pts/compress-pbzip2 | 9.67 | 9.74 | lower | compress-pbzip2 | compress-pbzip2 | All CPUs close to 100% user time. Short tests ~10 seconds per test case. | |
| pts/compress-7zip | 20486 | 20389 | higher | compress-7zip | compress-7zip | Repeated short tests on all CPUs, close to 100% user time. Total of ~40 seconds. | |
| pts/encode-mp3 | 32.77 | 32.73 | lower | encode-mp3 | encode-mp3 | Single threaded, close to 100% CPU. | |
| pts/encode-flac | 11.70 | 11.16 | lower | encode-flac | encode-flac | Single threaded, close to 100%. Very short runtimes. | |
| pts/x264 | 36.23 | 35.98 | higher | x264 | x264 | All CPUs, busy but not always 100%. i/o memory? | |
| pts/ffmpeg | 7.19 | 7.36 | lower | ffmpeg | ffmpeg | All CPUs, busy but not 100%. Short runs of ~9 seconds each. | |
| pts/openssl | 636.17 | 636.37 | higher | openssl | openssl | All CPUs, close to 100% user time. Tests ~20 seconds. | |
| pts/himeno | 1916.86 | 2045.81 | higher | himeno | himeno | Single threaded. Close to 100% CPU. | |
| pts/apache | 27272.28 | 26249.09 | higher | apache | apache | All CPUs, busy but not 100%. Proportionally high system time. | |
| pts/c-ray | 26.36 | 26.36 | lower | c-ray | c-ray | All CPUs, many simultaneous threads, close to 100% | |
| pts/povray | 131.24 | 131.17 | lower | povray | povray | All CPUs, close to 100% | |
| pts/smallpt | 80 | 78 | lower | smallpt | smallpt | All CPUs, close to 100%. | |
| pts/tachyon | 13.83 | 13.72 | lower | tachyon | tachyon | All CPUs, close to 100%. ~15 seconds runtime. | |
| pts/crafty | 7320247 | 7314067 | higher | crafty | crafty | Single threaded, close to 100%. | |
| pts/tscp | 1306401 | 1307021 | higher | tscp | tscp | Single threaded, close to 100%. Very short runtimes. | |
| pts/mafft | 4.59 | 4.66 | lower | mafft | mafft | All CPUs, many small process creations, close to 100%. Very short runtime total ~5 seconds per run. | |
| pts/stream | copy 19452.82 scale 14243.04 triad 16108.24 add 16135.70 | copy 19441.60 scale 14247.74 triad 16116.24 add 16154.56 | higher | stream | stream | All CPUs, close to 100% user time. |
Another useful tool from the likwid performance monitoring and benchmarking suite is likwid-topology. Provides thread (hyperthread), cache (L1, L2, L3) and NUMA (memory) topology together.
Output below shows my i7-4770S CPU is a 4-core hyperthreaded processor with a 32KB L1D cache, 256 KB L2 cache per core and a shared 8 MB L3 cache.
mev@popayan:~$ likwid-topology
--------------------------------------------------------------------------------
CPU name:	Intel(R) Core(TM) i7-4770S CPU @ 3.10GHz
CPU type:	Intel Core Haswell processor
CPU stepping:	3
********************************************************************************
Hardware Thread Topology
********************************************************************************
Sockets:		1
Cores per socket:	4
Threads per core:	2
--------------------------------------------------------------------------------
HWThread	Thread		Core		Socket		Available
0		0		0		0		*
1		0		1		0		*
2		0		2		0		*
3		0		3		0		*
4		1		0		0		*
5		1		1		0		*
6		1		2		0		*
7		1		3		0		*
--------------------------------------------------------------------------------
Socket 0:		( 0 4 1 5 2 6 3 7 )
--------------------------------------------------------------------------------
********************************************************************************
Cache Topology
********************************************************************************
Level:			1
Size:			32 kB
Cache groups:		( 0 4 ) ( 1 5 ) ( 2 6 ) ( 3 7 )
--------------------------------------------------------------------------------
Level:			2
Size:			256 kB
Cache groups:		( 0 4 ) ( 1 5 ) ( 2 6 ) ( 3 7 )
--------------------------------------------------------------------------------
Level:			3
Size:			8 MB
Cache groups:		( 0 4 1 5 2 6 3 7 )
--------------------------------------------------------------------------------
********************************************************************************
NUMA Topology
********************************************************************************
NUMA domains:		1
--------------------------------------------------------------------------------
Domain:			0
Processors:		( 0 4 1 5 2 6 3 7 )
Distances:		10
Free memory:		4592.59 MB
Total memory:		15726.3 MB
--------------------------------------------------------------------------------
Below is a table that summarizes installation and run status of the Phoronix Test Suite CPU suite.
Some background context of how this fits and where I hope to head from here…
Where I’d like to head is comparing micro-architectural features (e.g. caches, branch predictors,…), NUMA properties, OS features/policies (e.g. interrupt pinning) and other aspects with a set of benchmarks. There is however, a bit of circular dependency here. To make good comparisons, one needs good benchmarks and to get good benchmarks one either needs to have a representative sample or at least a good understanding of the range.
I don’t necessarily have these benchmarks up front, so my initial idea is to “prime the pump” by comparing a set of semi-random benchmarks on their properties and iterate with both the analysis and eventually adding other workloads.
The Phoronix Test Suite is a reasonable starting point to look at an initial set of codes to start comparing because of a few reasons:
On the downsides, the tests are of varying quality e.g. a number won’t build or install for variety of reasons and other have missing download files. Also, it seems many of the tests are smaller in terms of run-time, execution size, etc.
However, that is part of the idea off priming the pump to start. To make this start I wanted a number of tests – not so many that it becomes unwieldy and not so few that it becomes harder to generalize. Hence, I picked the “cpu” suite, a set of 25 benchmarks banded together.
Results of the initial install + run exercise are listed below. Of the 25, I had problems getting four benchmarks to quickly run out of the box. So I’ll skip these for now. A quick diagnosis of what prevents these four from running:
Note what also seems true is some of these microbenchmarks have known compiler optimizations (e.g. john-the-ripper) or tuning (e.g. ffmpeg, stream) needed to get absolute highest scores. The values below are for the benchmark as it comes “out of the box”, with some optimizations still pending.
| Test | Suites | Install | Simple run | Score | Notes |
|---|---|---|---|---|---|
| pts/padman | cpu | yes | yes | 198.97 | |
| pts/etqw-demo | cpu | yes | yes | 41.80 | required 32-bit libraries |
| pts/graphics-magick | cpu | no | no | -- | downloads fail |
| pts/john-the-ripper | cpu | yes | yes | 5937 blowfish, 20593667 des, 203603 MD5 | Seems to run when I run it by itself, but not when run as part of the cpu suite. |
| pts/ttsiod-renderer | cpu | yes | yes | 192.87 | |
| pts/compress-pbzip2 | cpu | yes | yes | 9.67 | |
| pts/compress-7zip | cpu | yes | yes | 20486 | |
| pts/encode-mp3 | cpu | yes | yes | 32.77 | |
| pts/encode-flac | cpu | yes | yes | 11.70 | |
| pts/x264 | cpu | yes | yes | 36.23 | |
| pts/ffmpeg | cpu | yes | yes | 7.19 | |
| pts/openssl | cpu | yes | yes | 636.17 | |
| pts/gcrypt | cpu | yes | no | -- | gcrypt libgcrypt-1.4.4/tests benchmark not found; compile errors with source |
| pts/himeno | cpu | yes | yes | 1916.86 | |
| pts/pgbench | cpu | yes | no | -- | The test run did not produce a result; doesn't run as root |
| pts/apache | cpu | yes | yes | 27272.28 | |
| pts/c-ray | cpu | yes | yes | 26.36 | |
| pts/povray | cpu | yes | yes | 131.24 | |
| pts/smallpt | cpu | yes | yes | 80 | |
| pts/tachyon | cpu | yes | yes | 13.83 | |
| pts/crafty | cpu | yes | yes | 7320247 | |
| pts/tscp | cpu | yes | yes | 1306401 | |
| pts/mafft | cpu | yes | yes | 4.59 | |
| pts/npb | cpu | yes | no | -- | Test quit with non-zero exit status; most likely MPI environment variables not configured for the run |
| pts/stream | cpu | yes | yes | copy 19452.82, scale 14243.04, triad 16108.24, add 16135,70 |