wspy – added topdown memory analysis
As a followup to a previous post, I’ve added support to wspy for topdown analysis for backend stalls.
Support for periodic performance counter sampling just required a config file to specify the counters:
# configuration file for top-down memory analysis
command --counterinfo /home/mev/.wspy/haswell
command --perfcounters
command --perfcounter-model core
command --set-counters RESOURCE_STALLS.SB,OFFCORE_REQUESTS_BUFFER.SQ_FULL,L1D_PEND_MISS.FB_FULL,CYCLE_ACTIVITY.STALLS_L1D_PENDING,CYCLE_ACTI
VITY.CYCLES_NO_EXECUTE,cpu-cycles
When wspy is invoked with this config file (–config topdown-mem.config), it creates *.csv files with the relevant counters. I then added a gnuplot script to plot from these *.csv files, e.g.
gnuplot <<PLOTCMD
set terminal png
set output 'topdownmem0.png'
set title 'CPU 0 Memory Stalls'
set datafile separator ","
set yrange [0:1]
plot 'perf0.csv' using 1:(\$3/\$2) title 'total stalls' with linespoints,'perf0.csv' using 1:(\$4/\$2) title 'from memory read' with linespoints,'perf0.csv' using 1:(\$7/\$2) title 'from memory write' with linespoints,'perf0.csv' using 1:((\$5+\$6)/\$2) title 'read bandwidth stalls' with linespoints,'perf0.csv' using 1:((\$4-(\$5+\$6))/\$2) title 'read latency stalls' with linespoints,
PLOTCMD
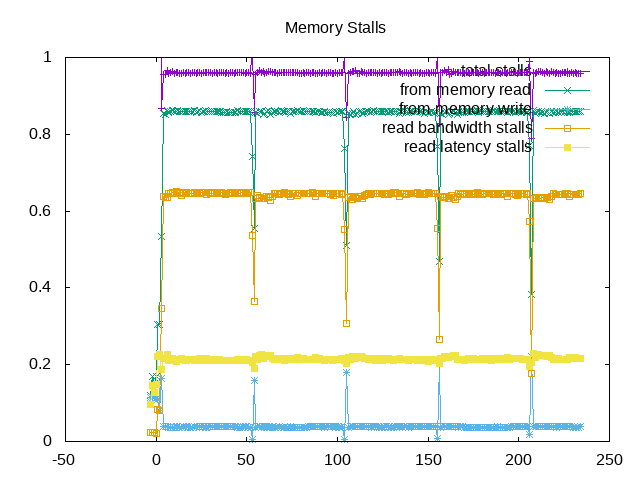
This results in plots that look like the following example for stream:
 About this graph
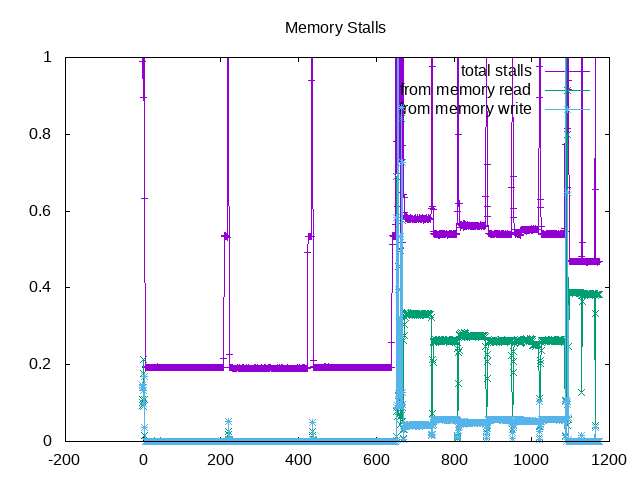
and following example for rodinia:
 About this graph
A few areas for follow up: (1) run the new configuration against other backend-bound workloads and update their analysis (2) look at wspy to add a numeric metric in addition to a graph (most likely not the full process tree, but need to investigate) (3) continue further analysis break downs.

Note: As noticed later, need to refine these metrics with new additional counters.