
wspy – performance counters
I have enhanced wspy to read performance counters. It now has three different instrumentation methods:
- Reading ftrace logfiles from kernel subsystem. Currently reads the scheduler events for fork/exec/exit to construct process trees
- Reading /proc/stat on periodic basis (once per second) to monitor CPU user, system and idle times. Similar method could be extended to read disk (/proc/diskstats) and network (/proc/net/dev)
- Reading performance counters. Each core has its own counters and for now read slightly different counters on each of the first four coresm and then repeat round-robin fashion for higher core numbers
Some future directions are both to extend these subsystems to additional measurements and to make it all more configurable, perhaps with a set of config files and command options.
Below are examples of gnuplot graphs coming from wspy:
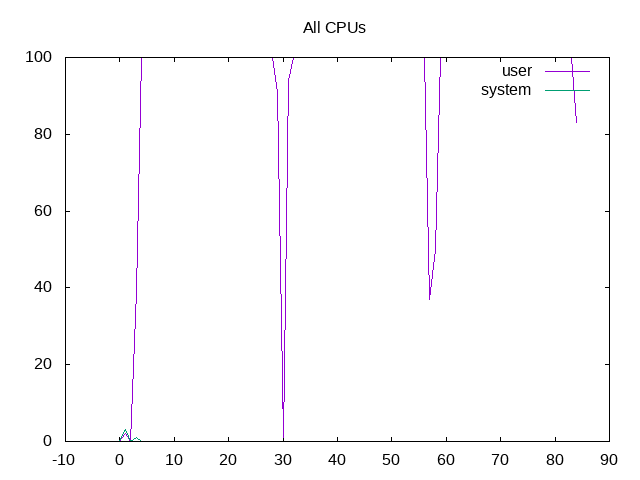
User and system time for all CPUs (total)
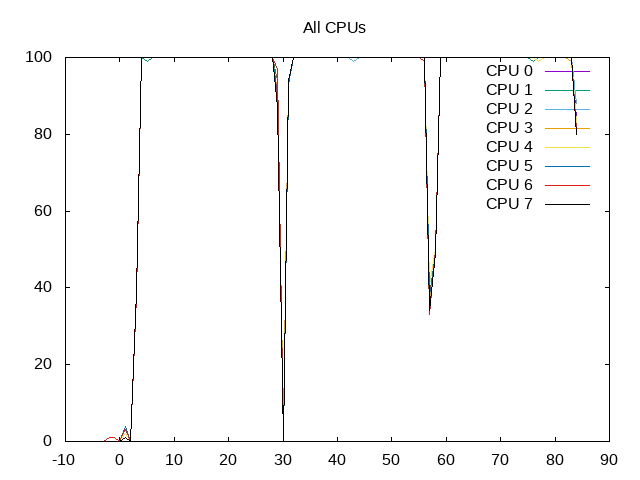
User and system time for all CPUs (separate)
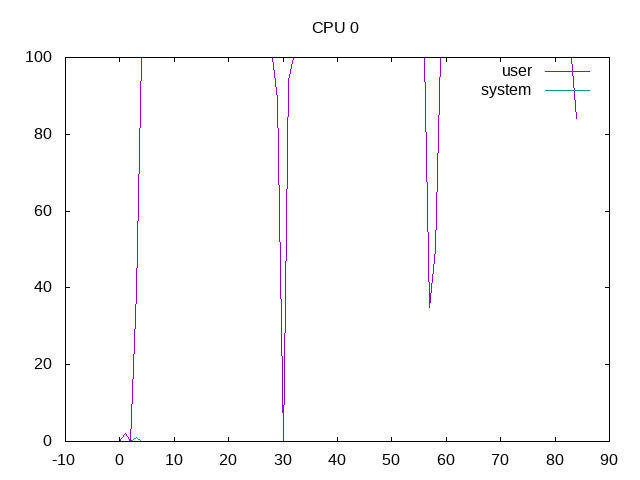
User and system time for one CPU
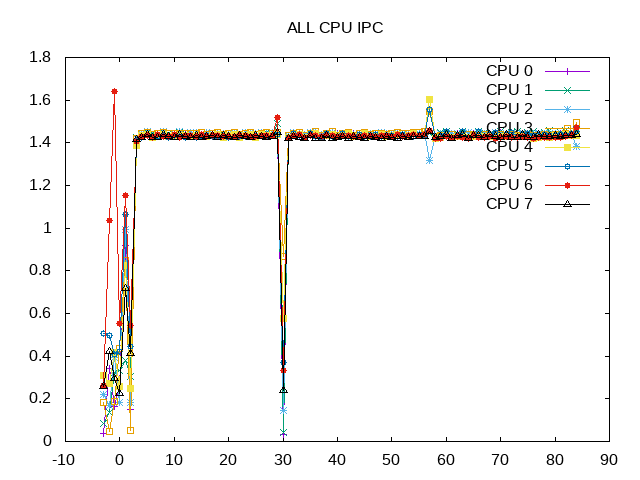
Instructions per cycle for all CPUs
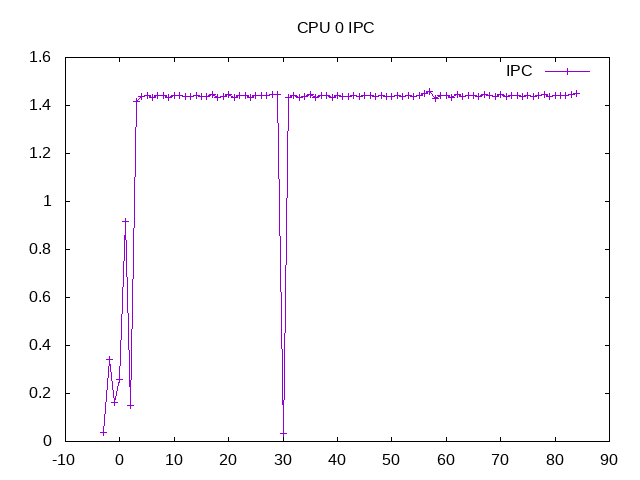
Instructions per cycle for one CPU
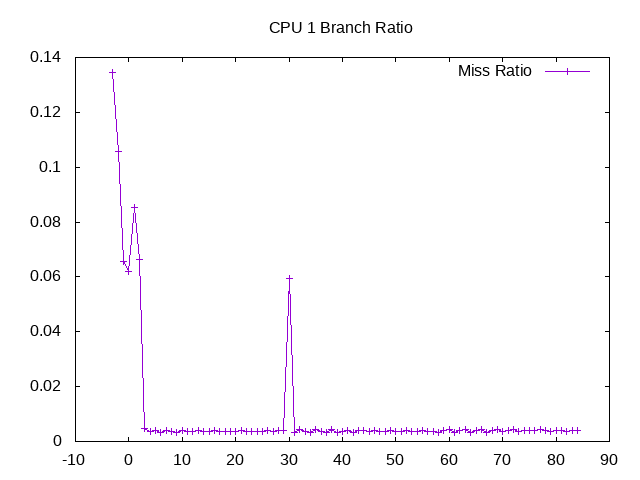
Branch prediction miss rate on one CPU
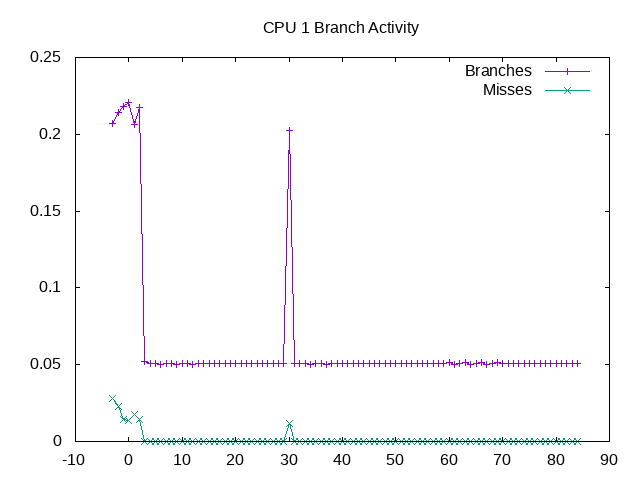
Branch rates on one CPU
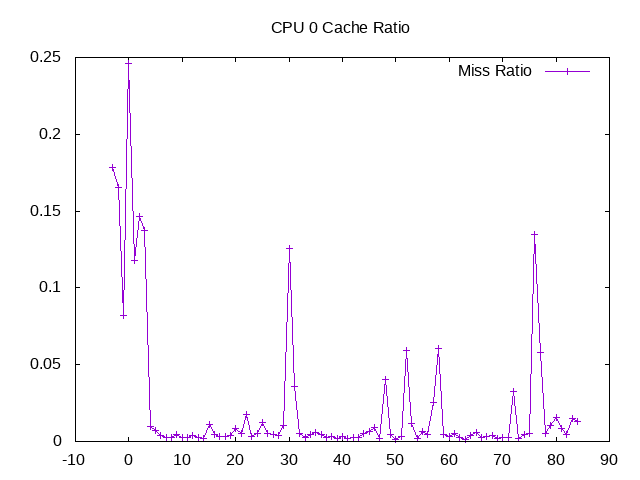
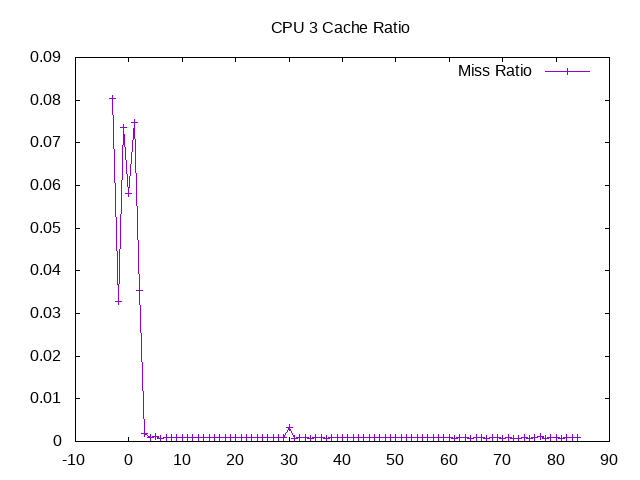
Last level cache misses from one CPU
L1D cache miss ratio from one CPU
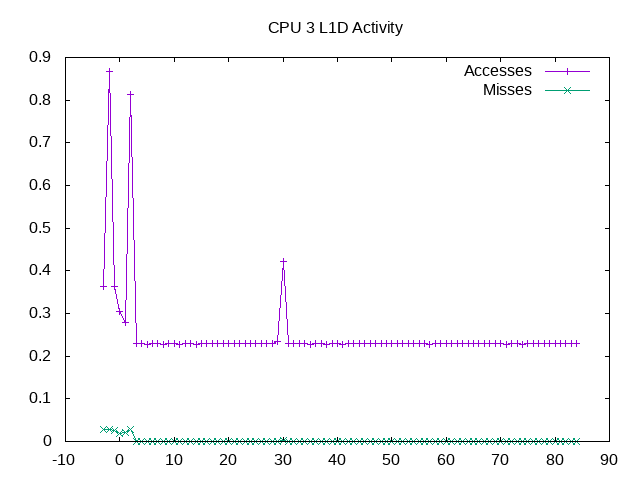
L1D cache activity
Comments
wspy – performance counters — No Comments
HTML tags allowed in your comment: <a href="" title=""> <abbr title=""> <acronym title=""> <b> <blockquote cite=""> <cite> <code> <del datetime=""> <em> <i> <q cite=""> <s> <strike> <strong>