Three basic metrics to assess a workload
This article summarizes three overall metrics to assess performance of a workload running on a microprocessor. These metrics provide an overall picture of what determines the performance and provide clues on where to dig for a deeper understanding. Following the discussion of the metrics, I provide examples using multiple workloads and describe how these metrics can be collected.
On CPU
The first metric is named On CPU. It measures what percentage of theoretically available time workload is scheduled to run on all cores of the CPU.
The Linux kernel schedules processes and keeps track of time each process is allocated to a core running either user code or kernel system code. This is the “utime” and “stime” of the process. If one sums up all the user time and system time for all the processes in an application and divides these by the total time, one gets “On CPU” or the percentage of total time the CPU is scheduled for this application.
This metric is shown by top(1) as the %user and %system and cumulative totals are kept in /proc/stat. For example, on my system
prompt$ grep cpu /proc/stat
cpu  25127290 1430744 17122980 8428762450 2816124 178712 463733 0 0
...
This tells me since my kernel booted 61 days ago, that the 16 cores on my AMD Opteron 6376 CPU spent somewhat over 251,272.90 seconds running user tasks(*), 171,229.80 seconds running system tasks and 84,287,624.50 seconds in the idle loop. In other words, the system has mostly been idle. The time spent in user tasks is actually 265,580.34 seconds since one needs to also add the second column of “nice” time.
A relatively low On CPU metric might come for many different reasons including:
- The application might be single-threaded, running only one process at a time and hence all the other cores are running the idle loop. This can be seen in the chart below with benchmarks such as encode-mp3 or phpbench. Even a much larger benchmark such as build-gcc might have periods such as link steps where the build is single-threaded, mixed with compile steps that can happen on multiple cores.
- The application might be competing with other (non-application) processes for time on the cores.
- The application might be swapped out waiting for a slow resource such as a disk. Note some resources such as waiting on memory that don’t cause a process to be swapped out, are not counted here but instead part of the IPC metric described later.
Knowing the On CPU metric for a workload provides avenues for further investigation both on causes and methods for potential speedups. For example, is it possible to restructure the application to run more parts in parallel? Is it possible to speed up an external component such as waiting on slower I/O devices?
When I see a On CPU metric that indicates a single-threaded workload, on a NUMA processor, I also might explore if pinning the threads to a single CPU might result in higher performance either by keeping caches warm or by minimizing higher latency paths.
One way of collecting this metric would thus be to sample /proc/stat both before and after the application runs and calculating the differences for the given time interval. This would give the overall time and would correspond what one would see by watching top(1). This might slightly over-count the amount of time since it would also include processes that are not part of the application.
In the wspy tool, I get this metric a slightly different way. Since wspy can trace all the processes for an application, I collect the individual utime and stime metrics of each process at exit and then sum them for the entire tree (subtree). This lets me decorate the wspy tree with On CPU metrics for all the branches and leaves of the tree.
| Benchmark | On_CPU | On_Core | IPC | Elapsed Time | Processes | Notes |
|---|---|---|---|---|---|---|
| build-gcc | 0.64 | 5.14 | 0.89 | 1338.77 | 335178 | Few missed thread events in wspy, but believe overall correct. |
| build-linux-kernel | 0.87 | 6.99 | 0.73 | 160.16 | 29140 | Few missed thread events in wspy, but believe overall correct. |
| c-ray | 0.99 | 7.91 | 1.44 | 26.52 | 130 | |
| compress-p7zip | 0.83 | 7.04 | 0.83 | 41.44 | 82 | |
| encode-flac | 0.11 | 0.89 | 2.43 | 11.11 | 6 | |
| encode-mp3 | 0.12 | 1.00 | 1.89 | 32.91 | 2 | |
| openssl | 0.99 | 7.94 | 1.66 | 20.17 | 10 | |
| parboil openmp cutcp | 0.88 | 7.07 | 0.85 | 15.06 | 13 | |
| parboil openmp lbm | 0.95 | 7.64 | 1.19 | 202.86 | 13 | |
| parboil openmp stencil | 0.91 | 7.25 | 0.31 | 29.75 | 13 | |
| phpbench | 0.12 | 1.00 | 2.76 | 18.50 | 2 | |
| pybench | 0.12 | 0.99 | 2.84 | 33.08 | 5 | |
| stockfish | 0.12 | 0.99 | 1.60 | 3.57 | 4 | |
| stream | 0.99 | 7.92 | 0.05 | 49.95 | 9 | |
| x264 | 0.69 | 5.49 | 1.30 | 17.33 | 12 |
On Core
The second metric is named On Core. It is essentially a variation of the On CPU metric, but instead compares the total user and system time spent by an application with that available by a single-core.
This metric becomes useful when one compares systems with different numbers of cores or situations where the number of cores has been constrained. As an example, following this section I have updated the previous benchmark table to now also include hyperthreading off (4 physical cores) vs. on (8 logical cores).
Comparing the hyper-threading on vs. off, we can see how the On Core percentage changes. A good compare/contrast shows up if we look at the build-gcc and build-linux-kernel benchmarks. The build-gcc benchmark doesn’t quite double its On Core number as the number of (virtual) cores is doubled. This essentially points out that there are serial parts of this build process (e.g. link steps) and these have a larger effect as the parallel portions (e.g. multiple compiles) increase with more virtual cores. In contrast, the build-linux-kernel benchmark doubles its On Core number suggesting that we haven’t yet hit limits of parallelism that result in diminishing returns.
The smaller benchmarks such as openssl also neatly double their On Core number. This along with the nearly 100% On CPU number suggest these benchmarks mostly run small worker threads that will nicely double as the number of virtual cores increases. The On Core metric thus also helps spot workloads that might most benefit from increased core counts vs. those that might be more constrained.
The On Core metric is a variation of the On CPU metric and thus it can be collected at the same time.
| Benchmark | Hyperthreading | On_CPU | On_Core | IPC | Elapsed Time | Processes | Notes |
|---|---|---|---|---|---|---|---|
| build-gcc | Off | 0.71 | 2.85 | 1.36 | 1536.63 | 349498 | Few missed thread events in wspy, but believe overall correct. |
| build-gcc | On | 0.64 | 5.14 | 0.89 | 1338.77 | 335178 | Few missed thread events in wspy, but believe overall correct. |
| build-linux-kernel | Off | 0.87 | 3.47 | 1.23 | 185.56 | 29143 | Few missed thread events in wspy, but believe overall correct. |
| build-linux-kernel | On | 0.87 | 6.99 | 0.73 | 160.16 | 29140 | Few missed thread events in wspy, but believe overall correct. |
| c-ray | Off | 0.99 | 3.96 | 2.68 | 28.41 | 66 | |
| c-ray | On | 0.99 | 7.91 | 1.44 | 26.52 | 130 | |
| compress-p7zip | Off | 0.89 | 3.58 | 1.20 | 28.43 | 42 | |
| compress-p7zip | On | 0.83 | 7.04 | 0.83 | 41.44 | 82 | |
| encode-flac | Off | 0.22 | 0.90 | 2.43 | 11.00 | 6 | |
| encode-flac | On | 0.11 | 0.89 | 2.43 | 11.11 | 6 | |
| encode-mp3 | Off | 0.25 | 1.00 | 1.92 | 32.41 | 2 | |
| encode-mp3 | On | 0.12 | 1.00 | 1.89 | 32.91 | 2 | |
| openssl | Off | 0.99 | 3.97 | 3.21 | 20.16 | 6 | |
| openssl | On | 0.99 | 7.94 | 1.66 | 20.17 | 10 | |
| parboil openmp cutcp | Off | 0.94 | 3.75 | 1.48 | 16.33 | 9 | |
| parboil openmp cutcp | On | 0.88 | 7.07 | 0.85 | 15.06 | 13 | |
| parboil openmp lbm | Off | 0.97 | 3.88 | 2.43 | 193.94 | 9 | |
| parboil openmp lbm | On | 0.95 | 7.64 | 1.19 | 202.86 | 13 | |
| parboil openmp stencil | Off | 0.93 | 3.71 | 0.56 | 32.61 | 9 | |
| parboil openmp stencil | On | 0.91 | 7.25 | 0.31 | 29.75 | 13 | |
| phpbench | Off | 0.25 | 1.00 | 2.71 | 18.85 | 2 | |
| phpbench | On | 0.12 | 1.00 | 2.76 | 18.50 | 2 | |
| pybench | Off | 0.25 | 1.00 | 2.86 | 32.77 | 5 | |
| pybench | On | 0.12 | 0.99 | 2.84 | 33.08 | 5 | |
| stockfish | Off | 0.25 | 0.99 | 1.60 | 3.60 | 5 | |
| stockfish | On | 0.12 | 0.99 | 1.60 | 3.57 | 4 | |
| stream | Off | 0.99 | 3.97 | 0.11 | 48.78 | 5 | |
| stream | On | 0.99 | 7.92 | 0.05 | 49.95 | 9 | |
| x264 | Off | 0.66 | 2.65 | 1.97 | 23.61 | 8 | |
| x264 | On | 0.69 | 5.49 | 1.30 | 17.33 | 12 |
IPC
The third metric is Instructions per Cycle. This ratio measures on average how many instructions are retired per cycle. While the On CPU and On Core metrics lead to investigations on how to get the application to spend more time using available cycles, the IPC metric leads to investigating bottlenecks that keep the program for more effectively using those cycles.
Those bottlenecks might be with inherent dependencies within the application or they might be bottlenecks within the micro-architecture or they might be waiting on external resources such as memory. The IPC metric doesn’t yet tell you *why* an application is retiring a particular number of instructions per cycle – but analyzing/comparing IPC is a start to further investigations to tease out effects due to the application, the micro-architecture or external factors. Further techniques such as:
- Modeling, e.g. modeling an ideal micro-architecture with (relatively) unconstrained resources might help find natural parallelism constraints within the application
- Competitive comparisons, e.g. comparing two processors to see how they run an application might give a clue on relative inefficiencies.
- Instrumentation, e.g. examining other performance counters might narrow in on the pipeline or memory system to find more detailed information about bottlenecks.
Hence, IPC is an important workload metric in starting such investigations but often a start to deeper investigation.
When one looks at a microarchitectural diagram of an architecture such as Haswell, one sees it is designed with features to exploit parallelism within an application. For example, Haswell can retire four micro-ops (uOps) per cycle and duplicated execution units, decoders and other pipeline stages to run these pipelines in parallel. Haswell tries to break branch stalls through prediction and tries to lower memory latencies though caching. Speculation lets the processor use some of this available parallelism to pre-compute potential paths even when branch choices aren’t know – and thus further reduce pipeline stalls.
With all of these features, one might ask why are so many of the IPCs in the previous table so much lower than a theoretical limit of four instructions per cycle? One factor would be breaking instructions into multiple micro-ops but there are many others.
An easy example is the STREAM benchmark which has the lowest IPC of all benchmarks in the list. STREAM is trying to measure the memory bandwidth available to the processor and hence works through a data set that is much larger than the cache sizes and an access pattern that keeps fetching new data rather than rely on the cache. Hence, the pipeline is stopped waiting on memory almost all the time and IPC is very low.
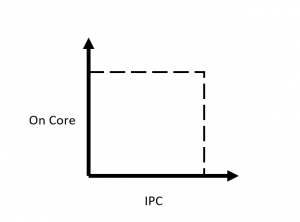
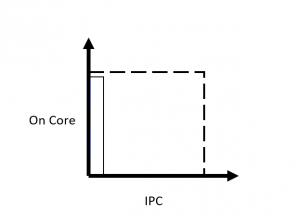
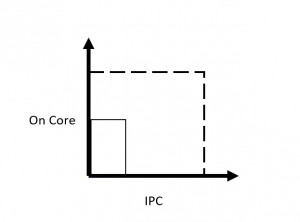
The IPC for the STREAM benchmark drops in half when hyper-threading is turned on. There are now two threads in each core trying to fetch from memory. The total number of instructions remains roughly the same because the work of fetching the stream arrays is partitioned among all the threads and hence each thread has approximately half the number of instructions to compute. However, the total number of available cycles has doubled since both cores are now available to compute. One way to see this graphically is to compare the On Core and IPC metrics together where the dashed lines represent an idealized maximum:

A third variable in this equation is the elapsed time, which in this example is the same between the two runs.

The 8 copy run of STREAM has an On Core of almost 8 and a low IPC of 0.05.

The 4 copy run of STREAM has an On Core of almost 4 and a low IPC of 0.11. However, in both cases the amounts of work being done is almost the same as measured by the total elapsed time to copy the entire array (and hence the total bandwidth in copying that array.
At the other end of the IPC spectrum, OpenSSL has a similar comparison between the hyper-threaded and non-hyper-threaded instances. However, with a much higher IPC, one wonders if perhaps this workload is being limited more by an architectural limit than by a factor such as memory.
The single-threaded benchmarks in my example are not as interesting in a hyper-threaded vs. non-hyper-threaded comparison as they have the full use of the processor core in both cases and hence the IPC remains pretty much the same in both cases.
What is a little more interesting are those examples in between where total elapsed time changes and the On Core and IPC metrics are not just mirror images of each other. There can be multiple causes including inherent parallelism in the workload (e.g. build-gcc vs. build-linux-kernel) or bottlenecks in uses of the micro-architecture.
IPC can be collected with the respective performance counters for instructions and cpu-cycles. On Haswell, there are dedicated metrics for both counters. Within the wspy program, the metrics are aggregated up the process tree allowing for comparison of an entire workload or well-defined subsections.
Summary
On CPU, On Core and IPC are three overall metrics to assess a workload. Along with the overall elapsed time, they give a high level picture of application’s resource usage. The metrics can be easily collected including for trees of processes.
These metrics do not answer the question of why behind performance of a workload, but do provide a starting point for comparing workloads, comparing microprocessors and investigating these differences further to suggest improvements.
For additional information see the metrics page.

Comments
Three basic metrics to assess a workload — No Comments
HTML tags allowed in your comment: <a href="" title=""> <abbr title=""> <acronym title=""> <b> <blockquote cite=""> <cite> <code> <del datetime=""> <em> <i> <q cite=""> <s> <strike> <strong>